09 - Brake Test SW Analysing results
Results can be viewed and analysed in several forms using the Brake Test Software package, and any graphs and tables can be adapted to suit the customers’ specific requirement for any given test.
.png?revision=1)
Results from Last Recorded Test
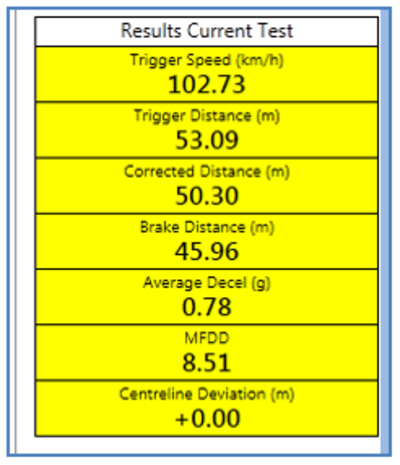
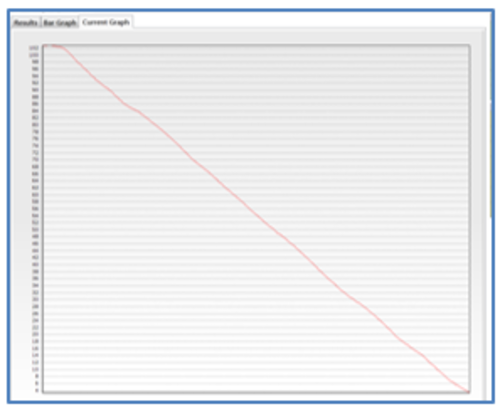
Results of the last performed brake stop test will be shown in numerical form in the Results Current Test tab, or in a more visual representation in the Current Graph window. The Current Graph shows the live plot of user configured channels for the current test run.
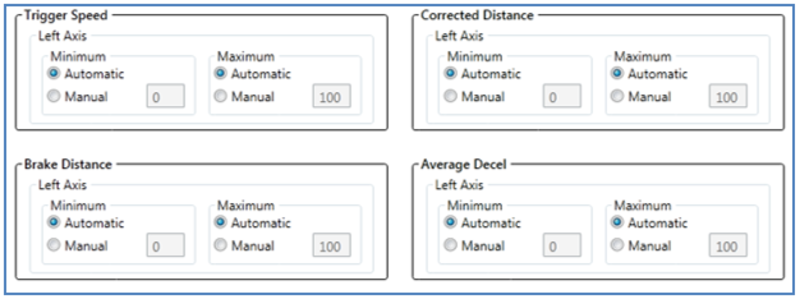
The Current Graph window can be altered by making changes to the Current Graph Set-up page under the Settings option. In the setup, both axis can be altered, different data channels be selected and a reset value determined.
.png?revision=1)
Collective Results
Figurative results are clearly laid out in a tabular form in the Results window. The test results by default will be shown in numerical order. The table can be toggled though by clicking on a desired column to order the test results by highest to lowest (or reverse).
.png?revision=1) |
.png?revision=1) |
Results can also be displayed in a much more visual representation using the Bar Graph window. This window displays all the measured results in a column bar graph form.
Results for Trigger Speed, Corrected Distance, Braking Distance and Average Deceleration are all shown here.
.png?revision=1)
The graphs are also adjustable using the Bar Graph Set-Up option, under the Settings menu bar.