10 - VBOX Tools Real Time Plot
Real Time Plot Screen
The VBOX Real Time Plot screen is a vehicle path plotting screen which is updated in ‘Online’ mode when a VBOX is connected to a laptop running the VBOX Tools software. It can also be used in ‘Offline’ mode using a replay function. As well as plotting the path, it can be used to measure times between points on a track set by the user.
It can also be used to replay a recorded file with a choice of four speeds. However, for most applications it is recommended that lap timing be done through the Report Generator screen.
The Real Time Plot screen is accessed by pressing the Real-Time plot button in the Main Button bar.
Virtual markers can be applied to the track and the timings between these markers are displayed in a table on the screen. The screenshot below shows four and a half laps of a circuit with a start / finish line and two split points. The numerical results of the test are shown in the table.
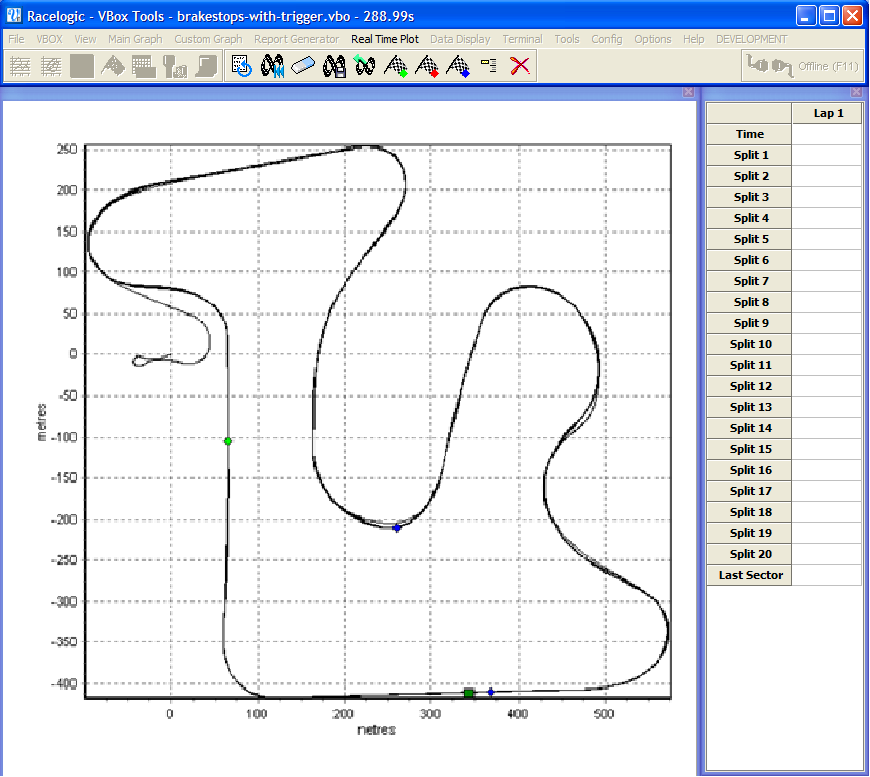
A file can be replayed in this window or plotted in real time, but for lap timing or split point times to be displayed, the position of these lines must be created or loaded into the software.
The data used to create this path of a vehicle is the Latitude and Longitude information calculated by the VBOX.
Options
There are a number of real time plot screen options to give control of use and setup of the screen
Changing the Replay Speed
|
Click the ‘Options’ icon on the Real Time Plot toolbar then select the ‘Replay Speed’ option. Then select the desired replay speed from the four options:
|
.png?revision=1) |
If the software has start, finish and split points loaded or created when a file replay occurs then the times relevant to these splits will be displayed in the columns on the right of the main display screen.
Screen Update Delay
This option allows the user to change the refresh rate of the Real Time Plot screen:
- 20 Hz
- 10 Hz
- 5 Hz - Default
- 2 Hz
- 1 Hz
Note that if you use a faster screen update, you may end up using a lot of your processor resources, which means the software can become un-responsive to user inputs until the replay has finished.
Split Time from Start/Finish
This option determines whether the split times are from split to split or from the Start line to the split line.
Overlay
An overlay can be used in conjunction with the real time plot by loading a circuit overlay file using the pull down menu under ‘Realtime Plot > Circuit Overlay > Load’. Note that in post processing mode, the target data file needs to be loaded first.
.png?revision=1)
The ‘Circuit’ option in this menu gives control of the colour and line thickness of the circuit overlay.
Manual Scale
The default option is for automatic scaling but if manual scale is selected then the scale of the real time plot window can be controlled on a slider bar at the bottom of the screen, or by clicking on the ‘+’ and ‘-‘ at the ends of the slider, or by using the arrow keys (Make sure the plotting screen is selected first by clicking on it.)
.png?revision=1)
Auto centre
This option cause the live or replayed position of the vehicle to stay in the centre of the screen. This is not available until the manual scale option is enabled.
Show Direction
This options adds a pointer to the vehicle path dot to show the current heading of the vehicle. This is not available until the manual scale option is enabled.
Live VBOX Data
With the Real Time Plot screen running and a VBOX connected to the computer, this screen will show the live path of the vehicle. In this mode Start/finish lines and split points can be placed so that live lap timing can be performed.
Replaying VBOX Data
A VBOX file can be replayed in this screen to show the path and to produce a table of lap timing and split line time results.
To replay a file, load the file into the VBOXTools software using the ‘File > Load’ icon, then click the ‘Replay File’ icon on the Real Time Plot toolbar..png?revision=1&size=bestfit&width=100&height=76)