17 - VBOX Tools Maths Channels
The VBOXTools software contains a facility that allows mathematical expressions to be created from a combination of VBOX data channels, numbers and mathematical functions.
An example of this facility could be the calculation of road gradient by taking the vertical velocity channel, dividing it by the speed channel and multiplying by 100, thus creating gradient as a percentage.
The Maths Channel facility can be accessed in two sections of the VBOXTools software.
- In the Graph screen the Maths Channel facility is accessed through the Generate New Channel button on the Graph toolbar.
- In the Report Generator screen the Maths Channel facility is accessed through the Maths Channel button on the Report Generator toolbar.
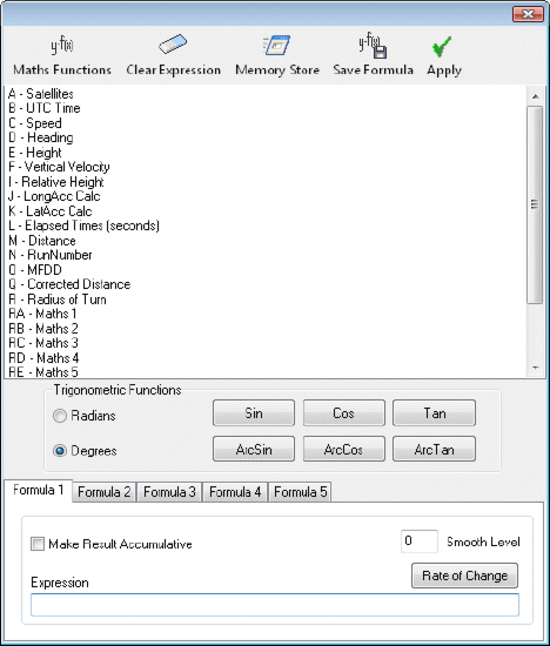
In the Report Generator screen five Maths Channels can be created and then used in the live or post processed data. These are permanently labelled Maths 1 - 5.
In the Graph Screen any number of new channels can be created from logged VBOX file information, providing the number of CAN channels plus new Maths Channels does not exceed 32.
Maths Channel Basics
|
Having selected the Maths Channel in Report Generator or ‘Generate New Channel’ in the Graph screen a new window appears in which the mathematical expressions are entered.
The main window shows a list of logged or live channels available.
The ‘Expression’ box is the area in which the mathematical expression is created.
A channel from the list is added to the expression by clicking on it. Basic maths functions are added to the expression box by typing them directly into the box. The symbols for the basic maths functions are:
|
 |
More complex mathematical functions can also be typed into the expression box or selected from the ‘Maths Functions’ drop-down menu .png?revision=1&size=bestfit&width=150&height=77) .
.
Creating a New Channel in the Graph Screen
The following example demonstrates the creation of a Gradient channel from logged VBOX data. Gradient is calculated by dividing Vertical Velocity (km/h) by Speed (km/h) then multiplying by 100.
Step 1: Loading the File
|
Load the logged file by clicking the ‘Load All’ icon and browsing for the file. Click on the ‘Graph’ icon to open the Graph screen, which will then show the loaded file. |
.png?revision=1) |
Step 2: Opening the New Channel Window
Click on the ‘Generate New Channel’ icon in the Graph screen toolbar. A new window will appear containing a list of available channels from the loaded file.
Step 3: Creating the Maths Expression
Click on the Vertical Velocity channel so that the capital letter associated with it appears in the expression box. Type ’/’ to add the divide symbol, click on the Speed channel to add it to the expression then type ‘*100’.
Step 4: Calculating the Maths Expression
|
Now click on the ‘Generate Channel’ icon at the top of the window. A box will appear with an example of your calculation performed on the data at the first sample point. Then a Channel Name box will appear into which you should type a channel name, in this case Gradient.
After clicking ‘OK’ the Channel Units box will appear; for this example ’%’ is used. Click ‘OK’ again and the new channel will appear in the channel list. |
|
.png?revision=1)
.png?revision=1)
Step 5: Viewing the New ChannelNow that a new Maths channel has been created it will appear in the list of available channels and can be viewed in the Graph screen like any normal channel. Step 6: Saving the New ChannelClick the ‘Save’ icon in the main toolbar to save the file with the new Maths channel to a new file. The new file will then include the Maths channel. |
.png?revision=1) |
Creating a Maths Channel in the Report Generator
This example details the creation of a Maths channel to show wheel slip, by determining a difference value between a CAN Wheel Speed channel and the Speed channel of the vehicle. The live results will be shown in the Report Generator screen, along with the five Maths channels. The Maths channels can also be shown in live windows.
Step 1: Connecting the VBOX for Live DataConnect the VBOX to the computer and switch the power on. Then connect the VBOX to the test vehicle CAN bus and configure the VBOX CAN input channels to pick up wheel speeds from the test vehicle. See the section ‘Configuring the VBOX and Modules’ for more information about how to enable CAN channels. Step 2: Running the Maths ChannelClick on the ‘Report Generator’ icon to open the Report Generator screen and then start the Maths Channel feature by selecting ‘Maths Channel’ from the Report Generator toolbar. A new window will appear, containing a list of available channels enabled in the serial data stream of the connected VBOX.
You can see in the screenshot above right, that the last four entries in this case are the four Wheel Speed channels for the test vehicle. |
.png?revision=1) |
Step 3: Creating the Maths Expression
The equation for wheel slip of one of the wheels as a percentage is:
(Speed – Wheel speed) / Speed * 100.
Click the required channels from the list to add them to the expression and type the symbols and numbers necessary to create the expression.
The formula should read as shown:
.png?revision=1) |
As this expression was created in the Formula 1 section, Maths channel 1 will now show the results from this equation. The window Formula 2 can be used to create a percentage slip channel for the other front wheel. Now the Maths Channel screen can be closed. |
Step 4: Configuring the Report Generator Screen
Now that a Maths channel has been configured the Report Generator screen will need a test profile to be set and a column added in which to display the Maths channel. In this case the test is a trigger activated brake stop, so the preset test setup ‘Trigger Test’ has been chosen. The column titles ‘maths channel1’ and ‘maths channel2’ are added to the columns.
.png?revision=1)
In the Test Set-up screen set the Line Conditions so that a data line will appear in the results when either of the Maths channels are greater than 10%. Effectively if the wheel speed becomes less than 90% of the vehicle speed then a data line will appear.
.png?revision=1)
Step 5: Creating a Maths Channel Live Window
To create a live window of the Maths channel right click on the Maths channel column title and select the option ‘View as Live Data’. In our case the new live windows will now show a live percentage reading of slip from our two front wheels.
.png?revision=1)
Maths Functions and Custom Formulae
Both the Maths Channel and New Channel features are capable of using advanced maths functions, such as square root and cosine, as well as allowing you to save your own formulae for future use. Formulae saved in the Maths Channel screen can be used in the New Channel screen, and vice versa.
To save a formula, it must first be entered in the ‘Expression’ text box (in the case of the Maths Channel screen, it can be entered in any of the ‘Expression’ text boxes). When the formula has been entered, click the ‘Save Formula’ button. You will then be prompted for a name for the formula. If you do not wish to save that formula (either because it is incorrect or because you only wish to save a different formula in the Maths Channel screen), press cancel. Otherwise, enter a suitable name and select ‘OK’.
|
Saved formulae can then be re-used by clicking the ‘Maths Functions’ icon and then selecting the required formula from within the ‘User Defined’ category. This menu also displays a list of standard maths functions, which can be inserted into the formula in the same way. |
.png?revision=1) |
Rate Of Change
Maths Channels can also make use of a Rate Of Change (‘ROC’) function, which will output the rate at which the selected channel is changing at every sample. This feature assumes that each sample occurs at the file’s normal logging rate, so erroneous results may occur if data has been lost.
It is important to note that the Rate Of Change function cannot be used in combination with any other maths functions within a single channel. However, a Maths Channel that uses the ROC function can be used as a data channel within other Maths Channels. So if, for example, a channel was required that showed:
Maths Channel = ‘Channel A + Rate Of Change of Channel B’
It could be created by making two Maths Channels:
Maths Channel 1 = ‘Rate Of Change of Channel B’
Maths Channel 2 = ‘Channel A + Maths Channel 1’.
Maths Channel 2 can then be used to show the required data.