VBOX Test Suite Update - V2.1
New Products
This release has added support for 2 new products:
- The VBOX 100 Hz Speed Sensors (VBSS100-V5)
- The VBOX 25 Hz Speed Sensors (VBSS25-V2)
You can find more information about these new products here.
Improved integration with VBOX 3i
The VBOX 3i v3 firmware is now available. It offers several improvements, such as flexible ADAS Setup, increased channel logging capacity, and improved integration with VBOX Test Suite. You can find more information here.
New Tests
This release has a new Dooring Test that has been added to meet the Euro NCAP Dooring scenario in the VRU active safety assessment.
You can find more information about this here.
We also have a beta version of our Euro NCAP Driver Status Monitoring (DSM) Test – this isn’t included in the installation, but we can arrange a demonstration upon request (email vbox@racelogic.co.uk).
New Features
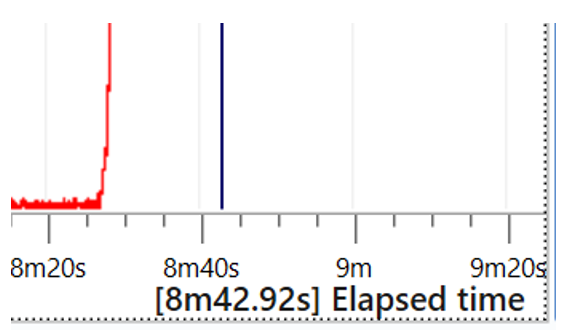
Display of current X-Axis valueThe X-axis value for the graph cursor position is now clearly shown on the graph next to the axis label. |
 |
Auto-scale Y-AxisYou can now auto-scale the Y-axis in a workspace window by double-clicking directly on the Y-axis on that specific graph. The graph will then change into a "best fit" scale. |
 |
|
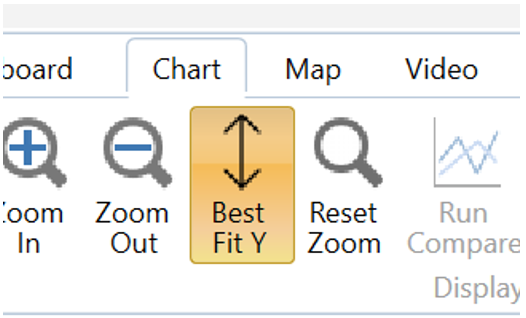
You can also click on the Best-Fit Y button to perform a best-fit auto-scale of the Y-axis for a chart in your workspace. Select the chart you wish to scale the Y-axis for and click on the Best Fit Y button. |
 |
 |
|
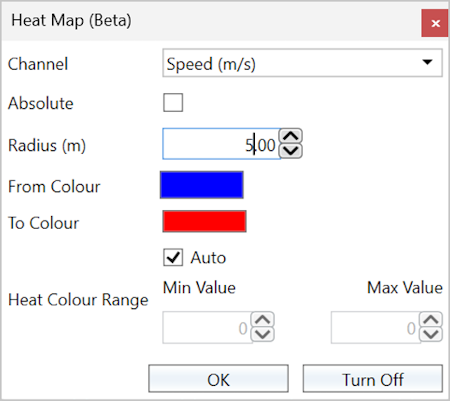
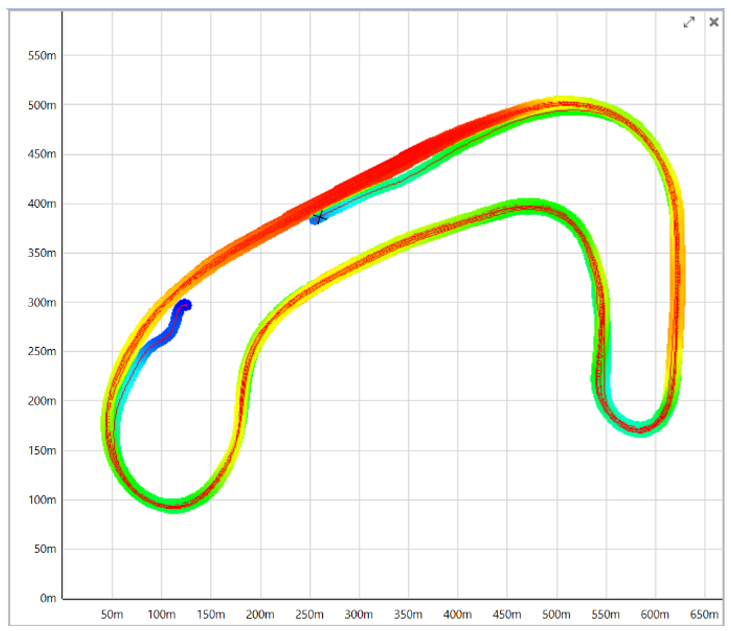
Heat MapIn response to customer feedback, the Heat Map feature on the Map ribbon tab now adds colour to the map to highlight a channel value at that location. You can, for example, choose to show a heat map of Speed or X Accel. If you select one or more runs, the heat map colour is derived from data of the selected run(s). Otherwise, the colour is derived from the whole session. If there are multiple data points in the same area, the points will be averaged. |
 |
 |
Map Measure line is now extendableAfter you have measured a distance on the map with the Measure tool, you can drag the ends of the line to change the start/end point. This gives you the ability to zoom in and fine-tune the start/end point. |
Other new features
|
Bug Fixes
- Fixed a bug that was reported by a customer who was experiencing crashes when conducting brake stops.
- Fixed a bug that causes the app to crash when exiting the test configuration while online.
- Fixed a bug with tests that included a ‘Calibration’ step failing to complete with V3 firmware.
- Fixed a bug preventing VBOX Test Suite from loading (in rare cases where the log file got very large).
- Fixed a bug with VBOX Test Suite not reconnecting to a VBOX if the VBOX was coldstarted while being online.
- Fixed the incorrect first sample value in the Rate of Change maths channels.
- Fixed a bug with maths channels calculated from other maths channels sometimes returning no value.
- Fixed a calculation bug in the J2263 Coastdown report (in some situations when using Split Runs.)
- Fixed a bug with mining load/dump ‘regions’ that were reverting to 0,0 lat/long upon reload.
- Fixed a bug with the Loaded state calculated in TxPH in mining, that was not being reflected in the Corner Analysis plugin.
- Fixed a bug with interim results that sometimes returned duplicate columns with blank results.
- Fixed a bug with not loading files exported from VBOX Test Suite with German language settings.
- Fixed a bug where data for channels including underscores ("_") did not show in the Separate Table of the plugin results section.
- Fixed a bug where exported gate names weren’t being retained when reimporting.
- Fixed a bug where VBOX Touch trigger stop distance was not correctly calculated for very low-speed brake stops (i.e. 6 km/h).
- Fixed a bug where the Speed at the Start of Test was sometimes reported as 0.
- Fixed a bug where Save As .vbo with German regional settings could result in incorrect values upon reload.
- Fixed a bug that caused transitioning issues for the vehicle overlay heading from 360 to 0 degrees.
- Fixed a bug causing accidental resets when dragging left on the chart by increasing the threshold for Reset Zoom.
- Fixed a bug where the mouse wheel did not work as expected after using Alt + arrows to navigate through the graph.
- Fixed a bug that caused occasional crashes when using online mode and changing test conditions or during calibration.
- Fixed a rare bug where result columns could show duplicate values in GTR15.
- Added a scroll bar to prevent vehicle overlay going off screen on displays with lower resolution.
- Fixed a bug with ‘Refresh Channel Names’ that could affect ‘Pass by Noise’ tests with V3 firmware.