03 - VBOX Tools Overview
The VBOXTools software provides you with a facility for setting up and configuring a VBOX and associated VBOX modules. The VBOXTools software also provides you with an ability to monitor live data in many formats. Real-time or offline data processing can also be performed through the software.
The software also provides a facility for the Serial VBOX data to be streamed live to a VBOX file recorded directly to the hard drive of a computer. This means that you can very quickly view data in the graph screen at the end of a test without the need to remove and load the file from the compact flash card. This Disk Logging facility effectively enables VBOX data to be logged direct to a VBOX file on the computer’s hard drive. See the ‘Logging’ section of this manual for further details.
The VBOXTools screen is structured with a main toolbar at the top that is constant to the software, certain options will change between live and greyed out based on which software module is currently in use.
Below the main menu bar is the button bar which is software module specific, for example if the Report Generator function is run, the report generator control functions appear in the second button bar.
.png?revision=1)
Software Menu Bar
The main software Menu Bar is the main control panel for the VBOX Tools software. It contains menus for all functions of the software and opening different data processing modules and views. Controls related to the loading and processing of data files and the set-up of the VBOX is performed from this menu.
NB: Certain menu options will be greyed out until a particular module has been selected for viewing. For example, the ‘Custom Graph’ menu will remain greyed out until the ‘Custom Graph’ button has been pressed and the module opened.
.png?revision=1)
The Menu bar options are as follows:
|
|
Software Button Bar
The Button Bar consists of the main button bar to the left, and a module specific button bar to the right which changes according to the software module currently loaded. For example in the screenshot below, the main button bar is visible along with the RepGen button bar.
.png?revision=1)
VBOX Source
Most functions of the VBOXTools software can be used in real time or for post processing.
The status of the ‘Connection’ button determines the source of the VBOX data being used by the software.
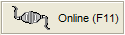
If the ‘Connection’ button is ‘Online’ the software is connected in real-time to a VBOX unit, the COM port number can be seen in the top title bar of the software.
 |
.png?revision=6) |
If the ‘Connection’ button is ‘Offline’ the software is not connected to a VBOX unit and the name of the file is reported in the top title bar of the software.
.png?revision=1) |
.png?revision=2) |
To toggle between data sources, click the ‘Connection’ button in the top right corner of the software (or press the ‘F11’ key).
The Source will automatically change in some situations when other functions are used. For example, if you are currently connected to a VBOX in ‘Online’ mode and you load a file through the ‘File à load’ option, the Source will automatically change to ‘Offline’. Similarly if you are ‘Offline’ and you click the ‘VBOX Set-up’ button then the Source will automatically change to ‘Online’.