04 - VBOX Tools File Menu
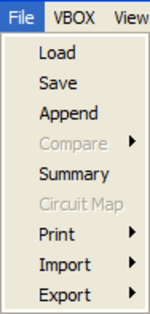
The file menu is used to control the data displayed by VBOX Tools. From the file menu it is possible to load in a data file, append data to an open file, compare two, three or four sets of data overlaid together, and save/export the data out of the software in various formats. Loading in a file displays the data in the graph, data and map windows if activated.
Load
The ‘Load’ option opens a file browser window which is used to navigate to the folder where a .VBO or .DBN data file is located, double clicking on the file will open the data file. If the data file has been logged by a Video VBOX it will have an associated video file which will be automatically loaded in to the software at the same time as the data file and will be displayed in a video player window.

Save
|
To Save a file select the ‘Save’ option in the file menu. If changes are made to the previously loaded VBOX file it may be required to save the file with a new file name.
The save facility has the option to include or exclude channels from the new file. After the ‘Save’ button has been pressed the window to the right appears, in which channels can be selected for saving.
The minimum recommended channels are checked by default but there is no restriction on which channels can be selected. |
.png?revision=1) |
.png?revision=1) |
If the file has been logged by a VBOX3i using an IMU, the measured channels will have been smoothed by the Kalman filter. If the Pre-Kalman unsmoothed data is also required then those channels need to be selected from the ‘Pre-Kalman Filter’ tab. |
| A number of channels such as ‘Acceleration’ and ‘Radius of Turn’ are calculated when the data file is loaded into the software, these are not selected by default as they will be calculated each time the VBO file is loaded. However, if the data is to be used by another software package these channels may be required. | .png?revision=1) |
Any CAN channels logged by the unit can be selected for saving from the CAN tab and if the data file was logged by a Video VBOX the user has the option of also saving the logged video data.
The user can add comments to the file header by entering data into the text box on the ‘Comments’ tab. NB: In the ‘Files of Type’ dropdown Menu in the file browser window it is possible to change the file type to either ‘.VBO’, ‘.CIR’ or ‘.CSV’. For more information on the use of ‘.CIR’ circuit files see the ‘Graph Setup – Map’ section of this manual.
Append
VBOX files can be joined together using the ‘Append’ option in the ‘File’ menu. A file browser window allows the selection of another file which will be appended to the current file. For example similar sections of test data in different files can be made into one file using this function.
Compare
|
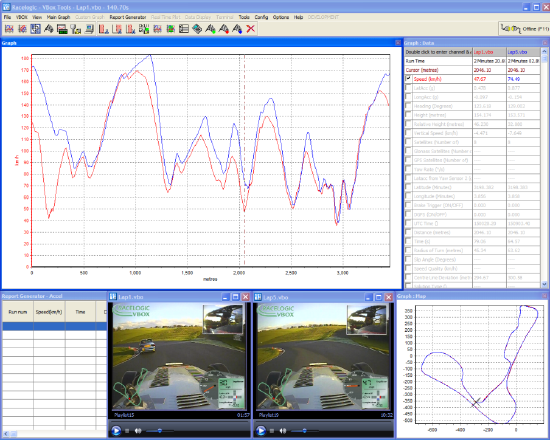
This function allows up to four similar data files to be overlaid in the graph screen and compared directly. For example two data files logged by separate sources starting at the same time can be compared.
This function is also extremely useful in comparing data from concurrent test runs, or laps of a track as in the example on the right.
See the ‘Post Processing Using Report Generator’ section for how to perform data comparison. |
 |
Load Compare File 1 - 3
This loads a data file into slot 1, 2, or 3 for comparison with the previously loaded file.
Save Compare File 1 - 3
This saves comparison file 1, 2, or 3. A file browser window will open allowing the file to be named and the save location of the file to be selected.
Remove Compare File 1 - 3
If a run needs to be removed the ‘Remove Compare File #’ option needs to be selected, this will clear the data file loaded into the selected slot and remove it from the graph window.
Summary
The ‘Summary’ option provides a quick way to view basic details of the file that is loaded.
When a file has been opened in the VBOXTools software the summary button provides a summary of the loaded file as shown on the right, and includes details such as the sample rate and number of lines in the file.
NB: For VBOX Summary, see ‘VBOX Tools – VBOX’ section.
Circuit Map
Loading a Circuit Map
|
A circuit map is a template that can be placed on the ‘Graph:Map’, over which the vehicle position data can be overlaid. A circuit overlay file can be loaded into the map window using the ‘Circuit Map’ option from the ‘File’ menu.
A circuit overlay file is a standard VBOX file, but saved with the suffix ‘.CIR’ instead of ‘.VBO’. Any file can be loaded in as an overlay file, just change the default ‘Files of type’ to ‘.CIR’ when loading it in. For more details on how to create a circuit overlay, see the ‘Creating a Circuit Overlay’ section. |
.png?revision=1) |
The graph, map, data windows, and real-time plots can all be printed independently by clicking the ‘Print’ option from the ‘File’ menu and selecting which display to print. The user has the options of printing any of the following displays:
|
|
Import
The ‘Import’ option allows the user to import a ‘.KML’ file from Google Earth.
If a circuit map does not exist for the track you are going to be visiting it is possible to trace the outline of it in Google Earth and export the path to a Google Earth ‘.kml’ file. The inside and outside of your chosen track should be traced, crossing over at the start/Finish line. The ‘.kml’ file can then be imported into VBOXTools for conversion to a track map by clicking on ‘File > Import’, then once the ‘.kml’ file has been imported it can then be saved from VBOXTools as a ‘.cir’ file for later use with lap data from the circuit.
Please refer to the Google Earth help files for instructions on creating paths in the software.
Export
Export to Google Earth
|
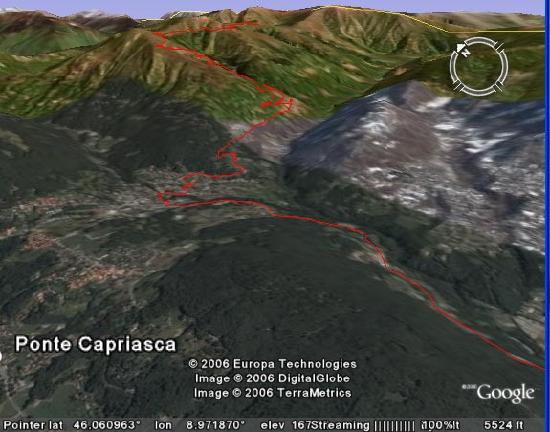
The ‘to Google Earth’ feature allows you to create a ‘.KML’ file that can be loaded into the free Google Earth software. The software can then display the main file and compare runs as different colours, and can even show split line and event trigger information.
To create the ‘.KML’ file, select ‘File’, then ‘Export’ then ‘To Google Earth’. A window will appear asking which data you wish to save. Tick the desired boxes then click ‘OK’, then select a destination for the save file. |
|
Applying Lat and Long offsets
|
After clicking the save button, an offset option window will appear next, in which you can specify an X (latitude) then Y (longitude) offset to the exported data. Due to the fact that often the overhead pictures used by Google Earth are not positioned exactly correctly you will find that your VBOX data may have an offset to the image. This can be compensated for using this offset facility. |
|
Viewing the data In Google Earth
To view the data in Google Earth, simply double-click on the .kml file’s icon, which will cause the software to automatically run, load and zoom in on the location corresponding to the .kml file. Alternatively run the Google Earth software and then click ‘File – Open’ to browse for and open the .kml file.
|
Note that the Google Earth limit on this file size is 65535 lines, which equates to the following:
If you have data files which are larger than this, VBOX Tools will automatically subsample the data to keep it within the Google Earth limit. This will ensure that longer files will be exported without being truncated. |
 |
Export to Route Mapping Software
The ‘To Mapping Software’ option allows a text file to be created from a ‘.VBO’ file that is suitable for direct import into Microsoft AutoRoute or Microsoft Streets & Trips, which will then show the path of the vehicle in the mapping software. There is also an option to create a special type of file for use with Google Earth software, which is covered in the section ‘Export to Google Earth’ above.
Select ‘File > Export’ then choose ‘To Mapping Software’ from the three options.
|
A small selection box will appear where the export rate can be chosen. This export rate directly determines how often a Pin marker is shown in the mapping software window. Select an appropriate rate then give the new file a name. For example, selecting ‘Every 1 minute’ will generate a file with positional data recorded every minute. This allows reduction of the file size when viewing large journeys in the mapping software. |
.png?revision=1) |
There is also a selection option called ‘Every trigger event’, which will make a data output at each trigger point. This can be employed as an easy way to see on a map the marked points of interest made using a brake trigger during your tests. When the rate is selected, the software will prompt the user for a file name under which to save the data onto the disk. Enter a suitable name for the output and click the ‘Save’ button to create a new file.
The data file created for import into the Mapping Software is in a semi-colon de-limited, ASCII text format. The parameters for each line are:
| UTC Time | Latitude | Longitude | Speed | Heading |
Exporting to Route Mapping Software
|
Open AutoRoute or Street & Trips. Click on ‘Data’, then select ‘Import Data Wizard’. When prompted, browse for the ‘.csv’ file you have just created and open it, then select ‘Comma’ as the delimiter and click ‘Next’. In column F2 select Latitude as the column name from the drop down menu. In column F3 select Longitude as the column name from the drop down menu, then click ‘Finish’. |
|
The program then generates a map of your data location and places markers on the map at every data point that was specified when the output file was created, for example once every second or at every brake trigger event.

.png?revision=1)
.png?revision=1)
.png?revision=1)