07 - VBOX Tools Main Graph
Overview
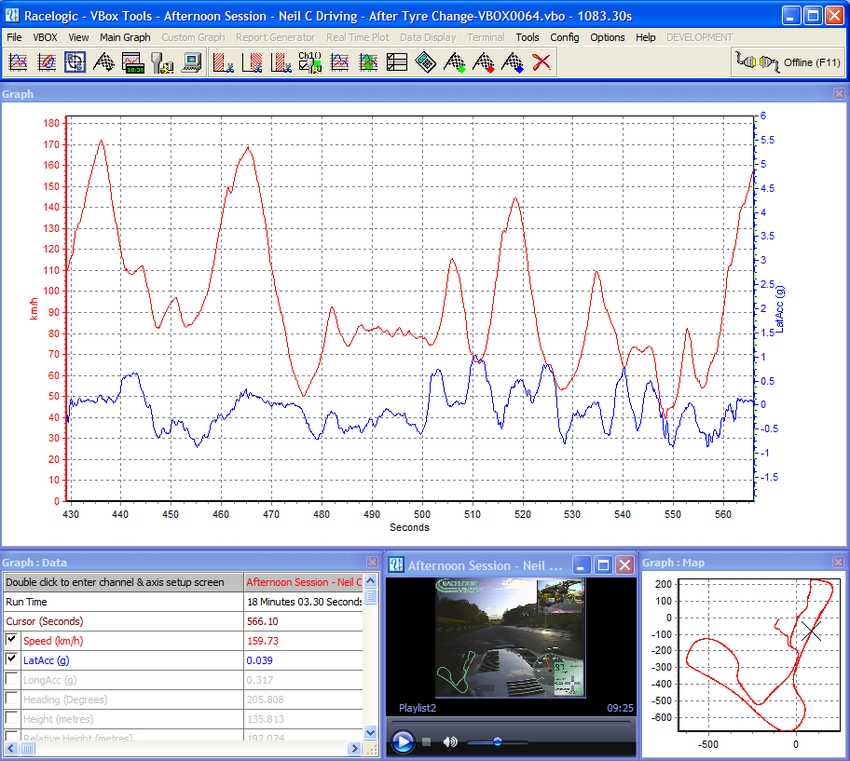
The VBOX Tools Graph Screen facility is a utility that allows VBOX files to be viewed and compared in windows: a main graph window, a data table window and a map window. In the graph window different parameters can be plotted against either time or distance. It also offers a facility to extract minimum, maximum, average and delta values between points in the viewed data. For more information on loading in data files see the section ‘VBOX Tools – File Menu’.
The map window shows the path of the vehicle, calculated from the latitude and longitude data, and in combination with the graph window can be used to define start/finish lines, and split points. A circuit overlay can be applied to the map window, allowing you to see the position of the vehicle in relation to the edges of the track. See ‘Application Notes – Circuit Mapping and Line Analysis’ for more details on how to add a circuit overlay.
Each of the three display windows can be resized by stretching the window, and all of these windows can be printed.
All of the parameters logged by the VBOX can be displayed, and the colours of each line can be customised. In addition to the logged parameters, a number of calculated channels (such as lateral acceleration and longitudinal acceleration) can be displayed.
.png?revision=1)
Up to three additional files can be loaded and displayed at the same time, making data comparison a quick and easy process.
By selecting ‘Graph’ on the main toolbar, the file that is currently loaded is shown as a speed against time graph. The graph window automatically sets the speed scale to show the maximum value contained in the file. If the data file was logged by a Video VBOX a video player window will also open.
Graph set-up options can be accessed either by clicking the “Channel and Axes Set-up” icon in the toolbar above the main graph screen, or by right clicking any of the Graph windows.
Moving Around the Graphs
Once a file has been loaded into the software (See ‘VBOX Tools – File’) and is displayed the data from the file can be examined more closely using the following basic functions: zoom, pan and cursor movement.
Zoom
Zooming in on the data in the graph or map window can be done three ways.
- Move the cursor to the beginning of the zoom area then click and hold the left mouse button and drag the cursor to the right with the mouse to the end of the zoom area (right and down for the map). Move the mouse in the opposite direction to zoom out to the limits of the data.
- Use the up and down arrow keys on the keyboard to zoom in around the current cursor position. Holding the shift key at the same time makes the zoom happen in bigger steps.
- If your mouse has a roll ball then this can be used to zoom in around the current cursor position. Holding the shift key whilst using the mouse roller ball will make the zoom occur in bigger steps.
Pan
To pan the view in the graph or map window, put the mouse over the area you wish to pan then click and hold the right mouse button and move the mouse in the direction that you wish to pan.
Cursor
The cursor position in the graph and map windows are linked and move together. The left and right arrow keys control the movement of the cursor. If the shift key is simultaneous pressed then it moves faster across the screen. The cursor can also be placed in the graph window by left-clicking the mouse button at the desired cursor position.
Exporting Graph and Map Images
The ‘Export Data’ in the Main Graph menu allows the Graph window or Map window to be exported in one of five image formats and also allows the data in the windows to be exported in text or Excel formats.
NB: Using this method to store data means that all smoothing applied to the channel will also be exported.
Editing a VBOX File
|
Sections of a VBOX file can be removed using basic editing commands accessed through the ‘Edit Data’ icon in the Graph screen toolbar. |
|
.png?revision=1)
Cut All Data before Cursor
This feature removes the entire file up to the cursor position in the main memory only. You can use this to select an area of the graph you are interested in and then save just a portion. .png?revision=1)
Cut All Data after Cursor
This feature removes the main memory file from the point of the cursor onwards. .png?revision=1)
Cut Data Between Two Points
This feature removes the main memory file between two specified cursor points. .png?revision=1)
Graph Setup - Graph
Selecting Channels
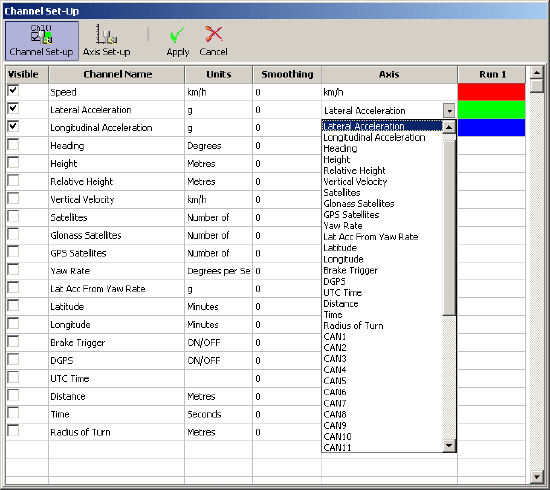
All values logged by the VBOX appear in the data window; all except those viewed the last time the software was used are initially greyed out, but the data can still be seen. To enable a particular channel (for example satellites) and make it visible on the screen, click in the tick box to the left of the channel name. For example, to display lateral acceleration:
The VBOXTools software will automatically scale the channel to its minimum and maximum values and show it in the graph window. The enabled channel will then be highlighted in its display colour.
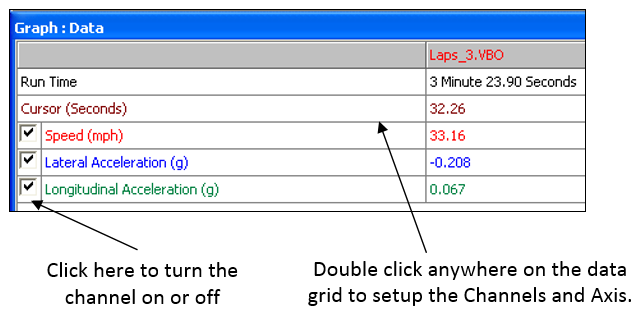
The data table contains all of the logged channels from the VBOX file plus Lateral and Longitudinal Acceleration and Radius of Turn channels, calculated when the file is loaded. By default only the speed channel is enabled. The list can be accessed by scrolling up or down to find the desired channel.
A channel can also be found by typing the first letter of the channel, for example ‘S’ for Satellites, providing that the data table is the currently active window. If there is more than one channel that starts with the same letter then press the key again until the software stops on your desired channel.
Channel and Axis Setup
For each channel there are a number of attributes that can be configured, including those relating to the y-axis. These are set up in the Channel Set-up and Axis Set-up screens, which are accessed by double-clicking on any of the channels in the Graph:Data table or by right clicking the mouse button in any of the graph windows and selecting the ‘Graph Setup > Graph > Channel and Axis Setup’ option, or by clicking the ‘Channel and Axis Setup ’ button in the button bar..png?revision=1)
Channel Setup
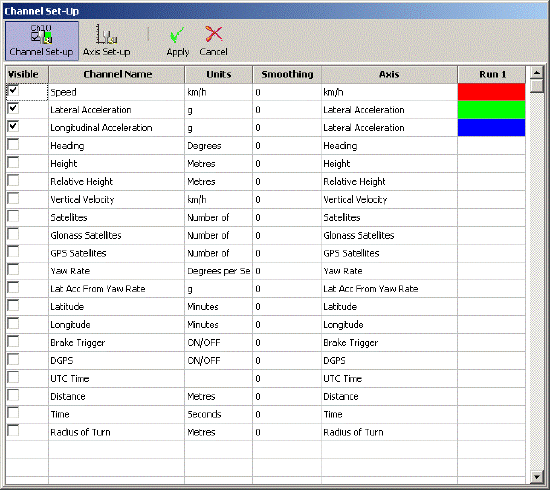
VisibleThe tick boxes in this column switch individual channels on or off in the graph window. Channel NameThis column contains the names of the available channels in this file. UnitsShows the units of each of the available channel. SmoothingIn this column a smoothing level can be applied to each channel individually. This can be useful for the Acceleration channels. The smoothing level number directly relates to the number of samples used in the smoothing routine (moving window). |
|
AxisDisplays which axis the channel is associated with. To change the associated axis, left click the mouse in the right hand end of the axis box once the channel has been made visible. Run 1This column shows the selected colour for each active channel. To change the colour click on the colour box of the channel and select a new colour from the colour selection box that appears. If compare files are also loaded then Run2, Run3 etc columns will be present in which the colours of these compare file channels can be set. |
 |
Axis Setup
The Axis Setup window contains all the controls needed for assigning and configuring the y-axis of the Graph screen.
VisibleEach tick box in this column switches an individual axis on or off in the graph window. Axis TitleShows the title of each available axis. The axis title can be edited by clicking on the box and entering a new name. Min / MaxThe Min and Max boxes allow the scale ranges for each axis to be set. AutoscaleThe autoscale option causes the axis scales to automatically fit the minimum and maximum values of the loaded channel. |
|
.png?revision=1)
Symmetrical
This option will cause the positive and negative maximum values on the axis to be the same magnitude. The magnitude of these will be determined by the largest positive or negative value of the channel.
Position
This option controls whether the channel Axis appears at the left or right of the Graph window.
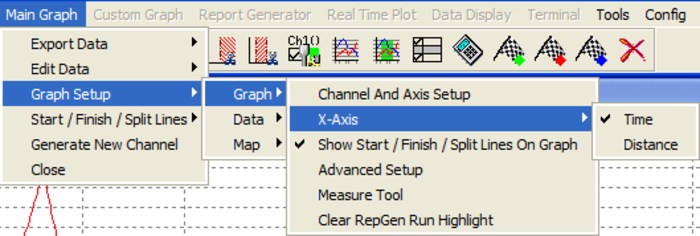
X-Axis
To swap the x-axis from Time to Distance either press the right mouse button anywhere on any Graph screen and click ‘Graph Setup’, or click the ‘Graph Set-up’ icon then select ‘Graph à X-Axis’, then choose one of the two options, ‘Time’ or ‘Distance’.
.png?revision=1)
Show Start/Finish/Split Lines On Graph
If this option is enabled then any Start/Finish or split lines will be shown in the main Graph as a vertical line.
Start/Finish Line – Green
Split lines – Blue
Finish line – Red
Advanced Setup
|
The Advanced Graph setup allows the graph parameters to be added and modified. Background and border colours can be changed, and a graph title and legend can also be added. |
.png?revision=1) |
Graph Measure Tool
This tool can be used to highlight a section of data in the Graph window and produce a table that summarises the data captured in the window. The data in the table shows start, end, difference, maximum, minimum and average values for each of the channels on display in the window.
.png?revision=1)
The area of data that is displayed in the table is highlighted in blue in the Graph window. This is often useful for quickly establishing average values between two points in a file. In this brake stop example it can be seen from the table that the average Longitudinal Acceleration during this stop was 0.905g.
Creating a Measure Tool Window
There are two ways to create a Measure Tool window.
- Follow the menu path “Main Graph ⇒ Graph setup ⇒ Graph ⇒ Measure Tool”, this will then guide you through the process with on-screen instructions. This process allows the use of keyboard cursor arrow keys to move the cursor, which can allow more precise positioning of the start and end points, than the mouse controlled method below.
- Move the cursor to the start of the section you wish to highlight. Then place the mouse pointer over the cursor position and press and hold the ‘shift’ key, then click and hold the left mouse button. Keep the left mouse button pressed and move the mouse cursor right to drag out a blue highlighted area. At the end of the area you wish to highlight, release the left mouse button. On release of the left mouse button a table of results for all channels in the highlighted area appears as in the screenshot above.
Saving and Printing the Measure Tool Data Table
Click the ‘Save to file’ icon in the Measure Tool toolbar to save the data in the table in one of two formats, ‘.CSV’ or ‘.TXT’. Click the ‘Print’ icon in the Measure Tool toolbar to print the table.
Clear Highlight
Selecting this option clears the highlighted run from the Main graph screen. This will only have an effect if RepGen has been run on a data set and one of the graph runs selected in the RepGen table..png?revision=1)
Graph Setup – Data
Show Selected Channels Only
The data table channel list can be reduced to only show the enabled channels, as in the example above, by clicking the right mouse button when the mouse pointer is in the data table, then selecting ‘Graph Setup > Data > Show Selected Channels Only’. This is very useful when you are moving the cursor through the graph window and wish to see the displayed channels data at the cursor point.
Graph Setup - Map
Measuring Straight Line Distance
|
The Graph Screen provides the possibility of measuring the straight-line distance between two points (as opposed to the distance travelled, which is more commonly shown). To do this, first right-click on the main graph window and select the option ‘Measure Straight Line Distance’. VBOXTools will then prompt you to position the cursor at the point at which measuring should start. You can then move the cursor to any point on the graph as normal; the distance will be displayed at the top of the Map screen. |
.png?revision=1) |
Set Map Window Position Cursor Type
|
The cursor type of the Main run and any compared run can be changed to any one of 9 different types. This is useful if two compared runs are being replayed to compare vehicle track position on two separate runs. To change the cursor type right click anywhere in the graph screen and select ‘Graph Setup > Map > Set position cursor type’ from the on screen menu. The following Menu will appear in which you can assign the cursor type for each of the four possible runs. |
.png?revision=1) |
Loading Map Background Images
|
Right click the Mouse anywhere in the graph screen and select the option ‘Graph Setup > Map > Map background Image > Set’ to load in a background image, or ‘Graph Setup > Map > Map background Image > Clear’ to remove it. |
.jpg?revision=1) |
Creating a Circuit Overlay
A circuit overlay is a VBOX file created to map the outer bounds of a circuit to improve track and driving line analysis when viewing data in the Graph screen Map window.
|
.png?revision=1) |
If you are using the internal RAM:
- Download the file from the VBOX.
- When it asks to save the file, select ‘Save as type’ and pick ‘Circuit file’ (.cir).
If you are using a compact flash card:
- Load from the compact flash card using ‘File > Load’
- Save using ‘Save’, select ‘Save as type’ and pick ‘Circuit file’ (.cir).
Now that a ‘.cir’ circuit overlay has been created, it can be loaded into the Graph screen and viewed in the Map window. This makes a great facility for driving line analysis, particularly if a local base station has been used to improve the VBOX’s positional accuracy.
In the example to the right, three different laps and the circuit overlay are shown in a zoomed Map window. The different lines through the corner of each lap can be seen clearly.
Aligning Circuit Tracks
It is possible to manually align the circuit views of comparison runs and also the overlay file. This is to correct for any GPS positional drift that may have occurred during runs.
To align the circuit tracks, first load a main file and at least one compare run or an overlay. Right-click in any of the graph screens and select ‘Graph Setup > Map > Align Circuit Tracks’.
You will be prompted to enter the number of the compare run to move, or ‘C’ for the circuit overlay.
After that you can move the selected plot using the cursor keys and you finish by pressing the ‘Return’ key. Holding ‘Shift’ whilst using the cursor keys will move the circuit plot by a greater amount.
You can adjust the amount by which each press of the keys moves the circuit plot by zooming in or out of the graph in the normal way; the further the graph is zoomed in, the smaller each adjustment will be.
Start / Finish and Split Lines
Defining Start / Finish Lines and Splits
To define a start / finish line, move the cursor in the Graph window to the desired point, when the vehicle is at the position at which you wish to place a Start / Finish, Finish or Split line, press the following keyboard keys or Button Bar buttons to place them:
- Start / Finish – ‘Spacebar’ –
.png?revision=1)
- Finish – ‘Shift’ + ‘Spacebar’ –
.png?revision=1)
- Split – ‘S’ –
.png?revision=1)
When the cursor is moved in the Graph window the cursor in the Map window follows this movement so you can see where the cursor point relates to on the track. After setting a start / finish line a green dot will then appear in the Map window at the corresponding cursor position.
Note: It is important to try to place Start/Finish line or splits at a fast part of the circuit to reduce the effects of positional error and to get the best lap timing accuracy; without DGPS or local correction the positional accuracy of VBOX is 3m 95% CEP (Circle of Error Probable; 95% of all samples will fall within a 3m radius of the actual point), so crossing a line that has a potential 3m error at the fastest speed will take a shorter time and therefore reduce the potential time error.
Set Combined Start/Finish Line
A Start / Finish line assumes the start and finish line are in the same position, as occurs on most circuits. A Finish line is primarily used when the start and finish lines are in two separate locations, such as slalom tests or hill climb courses.
Set Separate Finish Line
A separate finish line can be placed when the start line is not also the finish line. This is used in situations such as hill climbs or data analysis along a stretch of track that does not end where it starts. Create a finish line by holding the ‘shift’ key whilst pressing the space bar at the desired cursor location or by selecting the ‘Set Finish’ button from the ‘Start / Finish & Splits’ menu.
Setting Splits
A user selectable number of split points can also be set. However the more splits that are set the more processing power is required, so the number should be kept reasonably low (< 30). To define the split points, press the ‘S’ key at the desired cursor location or select the ‘Set Split’ option from the ‘Start/Finish/Split Lines’ drop down menu, or press the ‘Set Split’ Button on the Main Graph Button Bar.
Moving Splits
Splits can be moved by pressing ‘m’ in the Graph window and entering the number of the split to be moved, or by selecting ‘Move split’ from the ‘Main Graph à Start/Finish/Split Lines’ menu.
Once created, split lines can be saved into a split file for later use using the ‘Save’ option in the Start / Finish & Splits menu.
Loading and Saving Start / Finish Line and Split Data
|
Click on the ‘Main Graph > Start/Finish/Split Lines > Load’ icon in the main toolbar, you can then browse for a previously generated split file (‘.spl’, or ‘.dsf’) containing start / finish and split line information. Click on the ‘Save’ option in the same location to save to the start / finish and split line information created in the Graph screen to a ‘.spl’ or ‘.dsf’ file. |
|
Clearing Start, Finish Line, or Split DataTo selectively clear a Start, Finish or Split line from the graph window, select ‘Delete Start/Finish/Split (D)’ from the ‘Start/Finish Split Lines’ Menu. The pop-up window shown on the right will present the user with the option of which line to delete; S for Start/Finish Line, F for Finish Line, and a number designating which split point to delete. Clearing All Start / Finish Line and Split DataThe current Start/Finish and split file information can be cleared from the VBOXTools background memory and display screens by pressing the ‘C’ button or selecting ‘Clear All’ from the ‘Start / Finish & Splits’ menu in the Main Graph menu. Adjusting the Gate widthThe default width of the Start/finish and Split lines is 25m, 12.5m either side of the point of creation of the line. If this width is too big or too small then edit the value in this screen. An example reason for adjusting this width is if two sections of track run very close to each other and there is a risk that a split set in this location could be triggered on the nearby section of track. In this case the Width would need reducing. |
.jpg?revision=1) |
.jpg?revision=1)
Setting Split Names
|
Using this facility each split point can be given a name, this is particularly useful when splits points are placed at notable points on a circuit like named corners. This gives you a better indication of where the split point was set on the circuit. To set a name select the ‘Split Names’ option in the ‘Start/Finish Split Lines’ menu, then enter a name alongside a Split point in the split points window and press OK to apply the name. The name given to the split then appears in any text report in which split points are displayed, such as the Report Generator window shown below. |
.png?revision=1) |
Comparing Individual Runs
The comparing of individual runs from one or more files in the Graph Screen is achieved through the Report Generator screen. The Report Generator screen provides a quick an easy way to list runs from one or more files and then load these runs into the graph screen.
Please refer to the ‘Post Processing using Report Generator’ section of the Report Generator section of this manual.
Creating New ‘Maths Channels’
In addition to the standard, calculated and CAN channels available through a VBOX, the Graph screen can show a number of additional channels based on existing channels and mathematical expressions created by the user. These can then be displayed on the graph and in the data table and saved as a permanent addition to the VBOX .vbo file.
To create a new channel, click the ‘Generate New Channel’ icon and fill in the required fields of the new window that is displayed. Complete instructions on using this feature can be found in the ‘Math Channel’ section of this manual..png?revision=1)
Close
This closes the Main Graph Window.