08 - VBOX Tools Custom Graph
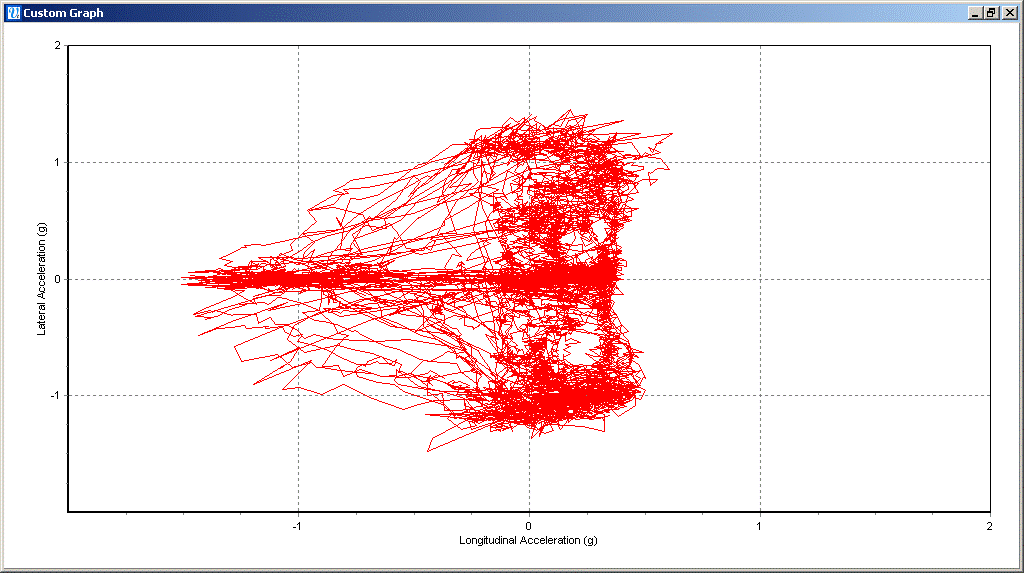
The custom graph facility allows any of the logged channels to be placed on either the x or the y axis of a Graph window. Up to four channels can be placed on the y axis simultaneously, making analysis simpler. An example of this is a g-plot where lateral acceleration is plotted against longitudinal acceleration. The screen shot below is a g-plot taken from some laps of a circuit. You can see by the shape of the plot that high braking (-ve g) is done in a straight line (low Lateral g). Also it can be seen that the shape of the plot is symmetrical showing that the same Lateral g can be pulled in either direction.
Creating a Custom Graph
Load your VBOX file into the VBOXTools software using the ‘File - Load’ option. Click on the ‘Custom Graph’ button. A blank Custom Graph window will appear and the Custom Graph toolbar will appear under the file menu bar as shown below.
.png?revision=1)
X-Axis
To select which channel to display select ‘Custom Graph > X-Axis > Data’ and select one of the channels from the drop down list.
Y-Axis
Assign up to four channels to the y-axis by clicking the ‘Custom Graph > Y-Axis’ and selecting which y-axis, 1 to 4 to change and then choosing a channel from the ‘Data’ drop down list. After assigning these channels click the ‘Update Graph’ icon.
Graph Type
The graph type can be set to either Line or Point graph.
Scales
|
You may find the x-axis and y-axis range values need setting to suit the data displayed. To adjust the axis range click the ‘Set Range’ icon, then enter the new values in the axis range box, shown here. The y-axis ranges are adjustable for each channel, via the tabs in the axis range box. |
|
.png?revision=1)
Update Graph
Click the Update graph button to set the graph screen to refresh the graph with the new settings.
Export
Click the ‘Export’ icon to select a format for exporting the Custom Graph screen image.
Close
Clicking the close button or selecting ‘Custom Graph > Close’ closes the Custom graph window..png?revision=1)
Cursor and Zoom
The custom graph cursor tracks the data line corresponding to the first y-axis whenever the left/right arrow keys are pressed. When the middle mouse button or up/down arrow keys are used, the custom graph view will zoom in or out around the cursor’s current location.