09 - VBOX Tools Report Generator
VBOX Data can also be easily viewed using our next generation data analysis software VBOX Test Suite, please click here for more information.
Overview
The Report Generator facility is designed to provide a fast and accurate method of producing text-based data.
After the column titles and test profile are set, a file can be scanned to show the results from all occurrences of the test profile in the loaded file. There are five preset test setup profile buttons that provide a very quick method of extracting data from test runs in a file, not only in the form of a results table but also for viewing the runs in the Graph screen.
For example, if a number of brake tests with a brake trigger are recorded onto a compact flash card then simply load the file, click on the ‘Trigger Test’ profile icon then press ‘Scan File (F2)’ to display results from all brake trigger stops in the file. Custom made Test Setups can also be made. The preset test setup profiles may be modified, renamed and saved for later use.
The Report Generator facility can also be used to replay files, with the results being shown in the Graph window and Live windows.
The title bar of the report generator shows the name of the test profile being used, including ones created by the user, and will show if the setup has been modified at all from the saved test setup profile.
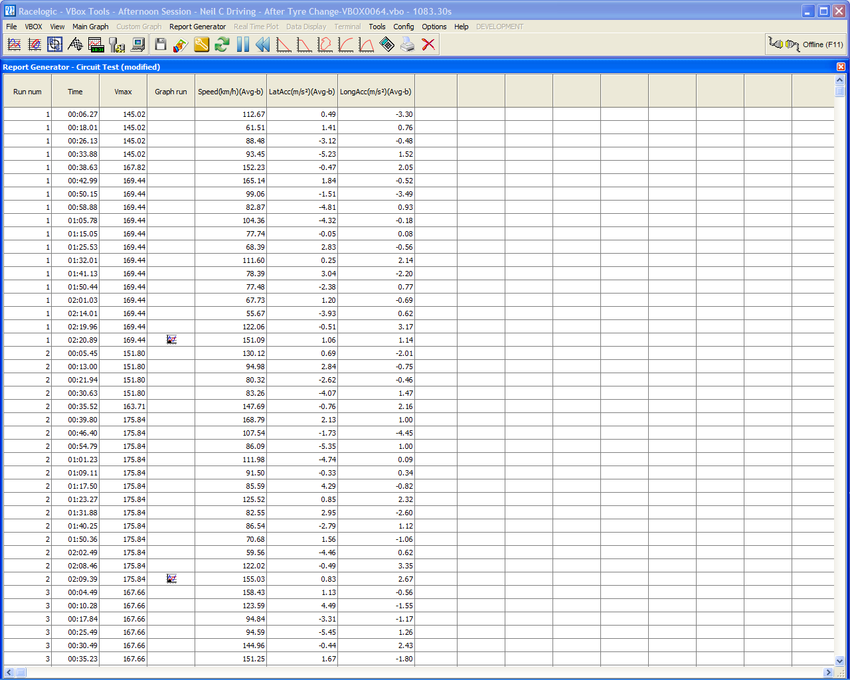
The screenshot shows the Report Generator screen including toolbar. In this case results from a circuit test are shown with data reported at intervals around the track.
When you first run the Report Generator facility, you will be presented with a large blank spreadsheet style window. For the Report Generator screen to be able to know what data to scan for and what data to display the column titles will need to be set and a ‘Test Set-up’ created.
Report Generator Basics
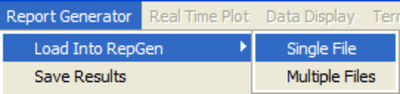
Load
Click on ‘File > Load’ in the menu bar to load a file into the VBOXTools software ready for analysis in the Report Generator screen or viewing in the Graph screen.
Click on the ‘Report Generator > Load into RepGen’ icon to load a file only into the Report Generator screen, without affecting anything on the Graph screen.
.png?revision=1)
The ‘Load into RepGen’ feature is particularly useful when you wish to load a number of separate files and compare portions of them on the same graph.
Printing and Saving Results
Printing
Click the ‘Print Results’ button in the Report Generator toolbar to print a copy of the current Report Generator results on a printer.
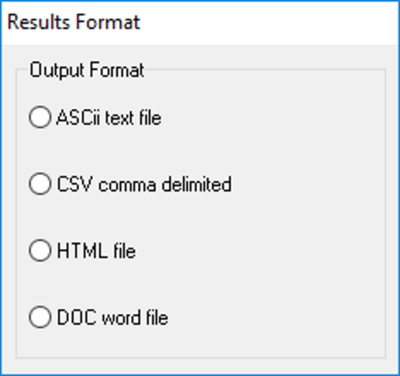
SavingThe current results in the Report Generator window can be saved in one of four output formats. Click the ‘Save Results’ icon in the Report Generator toolbar to bring up a format selection window. After selecting one of the four formats available a Windows Save dialogue box will appear. |
|
Copy and PasteIn addition to the ‘Save’ button, it is also possible to cut and paste data directly from the main report display to other applications such as Microsoft Word or Excel. To copy and paste data move the mouse pointer to the top-left cell of the information that is needed. Then click and hold the left mouse button while dragging the mouse pointer to the bottom-right of the required data. When the left button is released, it is possible to complete the copying of the data either with ‘CTRL + C’, or by clicking the right mouse button and select ‘Copy’. To paste the data, open the new application, for example Excel, then either right-click and select ‘Paste’ or use ‘Ctrl + V’ on the keyboard. |
.png?revision=1) |
Pick TestThe Pick Test option allows you to quickly and easily select a previously saved RepGen test, and load it in to the software. Click on ‘Report Generator > Pick Test’ and browse to the directory containing the saved Tests. Select the required test and click on the Load button. |
.png?revision=2) |
Test Setup
Selecting this option allows the modification of the Report Generator Test parameters.
Start/Scan File
‘Offline’
Click on the ‘Start/Scan File’ icon or press the ‘F2’ button to make the Report Generator software scan through the loaded file and extract and display results that fit the loaded test profile.
When a file is being scanned, the column headings will be highlighted in green to show that scanning is in progress. Then, if the conditions become valid for the test according to the chosen start and end conditions, the highlight will turn blue.
‘Online’
Click on the ‘Start/Scan File’ icon or press the ‘F2’ button’ to start the processing of the incoming serial data in order to display results that fit the loaded test profile.
When the Report Generator is scanning serial data, the column headings will be highlighted in green to show that the Report Generator is actively scanning incoming serial data and then turn blue when test start conditions are met and results are being displayed.
Pause
The ‘Pause’ icon will pause the Report Generator at its current cursor location within the loaded file. When scanning has been paused, pressing the ‘Scan File’ or ‘Pause’ buttons again will restart scanning from the current position, whilst pressing the ‘Reset’ button will delete the on-screen results and return to the start of the file.
Stop
If the Report Generator is being used in real time then the ‘Stop’ icon will stop the Report Generator software from scanning the live data from the VBOX.
Reset
The ‘Reset’ icon will clear the screen of all current results. The column headings will turn red whilst this function is being performed.
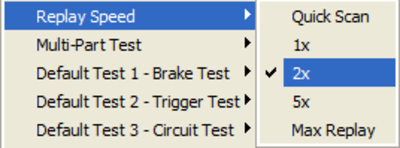
File Replay
|
The file replay option allows a file to be scanned at three different speeds. This is useful if you are also using live windows to view channels from the replayed file. The replay menu is accessed by clicking on the Report Generator menu then selecting Replay Speed. The available speeds are: Quick Scan, 1x, 2x, 5x, and the fastest your computer can achieve. |
|
.png?revision=1)
During the replay, the Map Window cursors will track vehicle positions of the vehicles with respect to time. In the Graph screen the cursor will also track the current position in the files.
The first screen shot below shows only a slight difference in track position (blue and red cursors) as expected at the start of the run. The second screen shot shows a large difference in track position achieved approaching the end of the lap by the faster run in red.
.png?revision=1) |
.png?revision=1) |
Note: If lots of live windows are also open then the replay speed may not always be exactly as selected due to the time taken to redraw the live data windows. This is especially true on slower computers.
Multi-Part or Batch Tests
The batch test option allows different types of test to be conducted in sequence, without the need for user-intervention. This can be useful for performing a variety of tests in a single session, or for performing equipment calibration runs and then feeding the calibration results into the subsequent test. Batch tests can be performed both in real time and in post processing.
In addition to the full range of test setup options, the setup files can contain screen layout configurations. This allows the Report Generator to change which parameters are displayed – and the position and format in which they are displayed – to show information in the clearest possible manner during each part of the test.
Using the Pre-Set Test Profile Buttons
The Report Generator screen has five preset test setup profiles that can be accessed by buttons on the Report Generator toolbar.
.png?revision=1)
If you wish to modify an existing profile, they are stored under the ‘Saved Tests’ directory in the main installation directory. These tests are created the first time they are used. They can then be modified and re-saved with the same name, and if they become corrupted, then simply delete them, and the software will re-create them the next time you press the relevant button. They can also be modified and renamed to suit the users requirements.
Brake Test
|
This test profile will automatically set the column titles to: Start Conditions 100km/h and End Conditions 0km/h. |
|
.png?revision=1)
Trigger Test
This test profile will automatically set the column titles to:
Start Conditions Brake Trigger and End Conditions set to 0km/h. The test setup options have also been set so that only the end result of each brake stop is shown allowing results of many tests to be shown in the same screen.

Circuit Test
|
This test profile will automatically set the column titles to: Start Conditions set to start / finish line and End Conditions set to start / finish line, thus displaying lap times. Note: a ‘Split’ file (.spl) containing start / finish line data must also be loaded. |
|
.png?revision=1&size=bestfit&width=400&height=71)
Accel Test
This test profile will automatically set the column titles to:
This test setup is set to have Start Conditions set to 0km/h and End Conditions set to “End of acceleration” (see below). Also, data lines will be created every 10km/h.
.png?revision=1)
0 - 0 (Zero to Zero)Test
This test profile will automatically set the column titles to:
Start Conditions set to 0km/h and End Conditions set to 0km/h, this separates the results into individual runs starting and ending at zero.
.png?revision=1)
Post Processing Using Report Generator
This guide explains how to extract data from a VBOX file and display the results in a table and then compare selected runs in the Graph screen. In this example the file will contain a number of acceleration runs, but the same theory applies to any style of test.
Step 1: Loading a File
|
Open the Report Generator screen by clicking the Report Generator button in the main button bar then load a file using either the File menu or the ‘Report Generator > Load into RepGen’ option. |
.png?revision=1) |
Step 2: Setting the Profiles
Specify some column titles and configure the Test Set-up profile to select the required data from your file; see ‘Creating a Customised Test Profile’ in this chapter for more detail. Alternatively, select one of the pre-set test icons, (from the Report Generator toolbar) that most suits the test you wish to view; see ‘Using the Pre-Set Test Profile Buttons’ in this chapter for more details. In our example we selected the pre-set test profile ‘Accel Test’..png?revision=1)
Step 3: Scanning the File
|
Now that the test profile has been set and the file has been loaded, click the ‘Scan File’ icon to start the software processing the file for every run that matches the test profile. The results of this scan will be displayed instantly in the Report Generator grid. To the right, you can see the results from the Accel Test scan. In this case 3 valid runs have been detected, with data at every 10km/h shown in the table. This report was created from the example file ‘accel_example.vbo’, which has been included on the VBOXTools software CD. The User Text column can be inserted to add notes on the testing. These notes are then saved with the results. Highlighting a RunIf the Graph screen was open during file scanning, it is possible to show the location of each run on the graph. Simply click on the last line of the desired run and it will be indicated on the graph by a green highlight. Note that this will not work if you click on a cell containing an icon or an include box. |
.png?revision=1) |
Step 4: Viewing a Run in the Graph Screen
To display one of these runs in the Graph screen click on the ‘Graph’ icon shown at the end of each run in the Graph run column. The Graph screen will now appear showing the data from this run in the Graph, Data and Map windows of the Graph screen. All of the windows in view can now be moved so that all data can be seen on the screen..png?revision=1)
Step 5: Comparing Runs in the Graph Screen
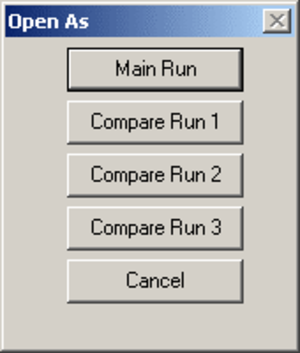
To compare another run from the Report Generator results in the Graph screen, click on the ‘Graph’ icon of the chosen run. A selection box will appear; select one of the ‘Compare Run ’ buttons so that the run gets loaded as a comparison file. The run to be compared will now appear alongside the original run in the Graph screen, as shown in the example screen below.
As you can see the main run is shown in red and the compare run in blue. Because this is now running the full graph screen, all facilities of the Graph screen are available.
.png?revision=1) |
.png?revision=1) |
Step 6: Comparing Runs from different files in the Graph Screen
|
If you wish to compare runs from different files then you need to load the first file and follow the steps 1-5 above. To then load in the second file for comparison click on the ‘Load into RepGen’ button from the Rep Gen tool bar. |
.png?revision=1) |
|
This will then load the file into the Report Generator section of the software and not overwrite the file information already displayed in the Graph window. With the second file loaded simply press the Rep Gen ‘Scan’ button. Runs that fit the test profile will be extracted and displayed in the Report Generator table. Now click on the Graph Icon of any of the newly displayed runs that you wish to compare in the graph screen. The ‘Open as’ window will then appear allowing you to compare the run to an existing run in the Graph screen. |
.png?revision=1) |
Multiple Lap Replay
It is possible to compare two or more circuit laps from different logged files then replay the files so that corresponding vehicle track positions from each run can be viewed as the replay occurs. This is very useful to see graphically at which points on a circuit one driver loses or gains time.
Follow instructions 1-6 above to load two or more compared runs into the graph screen.
The example shows two laps from the same circuit , the lap in red is a faster lap as can be clearly seen by the higher speeds achieved at many places throughout the lap.
.png?revision=1)
Live Analysis Using Report Generator
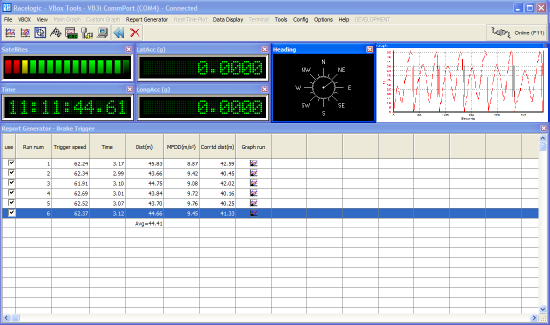
This guide explains how to extract test results from live VBOX data, display the results in a table and then compare selected runs in the Graph screen. In this example the test data was from a number of trigger brake stops, but the same theory applies to any style of test.
Step 1: Setting Real Time Mode
Because the data for this test is coming direct from the serial port of a VBOX the source mode needs to be swapped to ‘Online’ mode. Do this by pressing ‘F11’ or clicking the ‘Source’ icon so that it is in ‘Online’ mode.
If the Disk Logging window is not in view on the screen then enable Disk Logging by clicking on the ‘Tools’ icon in the main toolbar and selecting ‘PC File Manager’ from the drop-down menu. See the ‘Logging to Computer Hard Disk’ section of this manual for further explanation.
Click on the ‘Report Generator’ icon in the main button bar to open the Report Generator screen.
Step 2: Setting the Profiles
Now set the test profile for the test to be performed, in this example a brake stop. To do this select one of the preset test profiles from the Report Generator toolbar or load a custom profile. Alternatively create a new one for this test. In this example we have used the preset ‘Trigger Test’ profile.
Step 3: Creating Live Windows
|
In addition to the live data results appearing in the Report Generator window, live windows can be created to display calculated data from the VBOX during the test. See the section ‘VBOXTools - Data Display’ of this manual.
For example if MFDD is set as one of the columns in the Report Generator window, then a live window can be created that will display the MFDD result. To display a column’s data in a live window right-click the mouse on the column title and select ‘View as Live Data’. |
|
.jpg?revision=1)
If the speed at start, split or finish lines is required, it is recommended that the “Lap Timing” live windows are used because these will only be updated upon crossing the appropriate kind of start, split or finish line. (Normal speed live windows will be updated every sample, or every RepGen results line, depending on how the live window was created).
To create a “Data Display - Lap Timing” live window, use the “New Data Display” icon in the main menu and then select the appropriate channels from the Lap Timing group.
Step 4: Conduct the Test
|
Click the ‘Start’ icon or press ‘F2’ to make the Report Generator software start scanning the VBOX data. Pressing the ‘Start’ button will also start the Disk Logging if it wasn’t already running. Now everything is set for the test to start. In our example, when a brake stop is performed the Report Generator screen will show results from trigger to zero. The live windows will show constant data and the live windows created from the Report Generator will update accordingly. In the screenshot on the right, the results from the live brake stops can be seen in the Report Generator grid. Live data windows show the Time, number of Satellites, Speed as both a line graph and analogue display plus smoothed longitudinal acceleration as text. |
 |
Step 5: Viewing the Data in a Graph Screen
|
To view any of the runs that the Report Generator window has captured first click the ‘Stop’ icon or press the ‘F3’ key to stop the Report Generator software scanning live data. Then click the ‘Graph’ icon from whichever run you wish to view. This will then open the Graph screen, loaded with the data from the selected run. If you wish to compare another run from the data in the Report Generator window, click on the ‘Graph’ icon for the selected run and select one of the ‘Compare Run X’ icons to load the second file as a compare file. |
.png?revision=1) |
.png?revision=1)
Creating a Customised Test Profile
Setting the Column Titles
|
The first step when setting up a customised profile is to configure the parameters that are to be displayed for the test. If a test setup is already loaded, clear any of the unwanted columns by pressing the right mouse button when the cursor is over any of the grey title boxes. This brings up an option box with ‘Insert Column’, ‘Delete Column’, ‘Clear Column’ and ‘Clear all Columns’ options. You will then need to add channels that are required for your test to the grey blank column titles; click on the grey box at the top of the first column in the Report Generator screen. A box will appear with a drop-down menu indicating the data for that column, ‘Blank’ by default. |
|
.jpg?revision=1)
|
Click on the arrow on the right-hand side of the word ‘Blank’ to drop down a list of the available parameters. The list contains all of the logged parameters stored in the VBOX data file and calculated values such as distance. If external channels such as those from an ADC03 analogue module or TC8 thermocouple module have been logged in the VBOX data file then these channels will also be listed. Also listed are the Maths channels set up using the Maths channel facility. After selecting the data channel from the drop-down menu the box shows a list of attributes that can be applied to the data channel. The column label can be edited and a multiplier and offset applied. Average From StartThis will average all of the sample values in the file between the start and current line of a run. Average Between Test LinesThis averages all sample values between current displayed and previous data lines. |
|
.jpg?revision=1)
Minimum
This displays the minimum value of this channel for each run up to the current line.
Maximum
This displays the maximum value of this channel for each run up to the current line.
Minimum between test lines
This displays the minimum value of this channel between the display line and the previous display line..
Maximum between test lines
This displays the maximum value of this channel between the display line and the previous display line..
Delta Between Test Lines
This displays the difference between the values on the current and previous test lines.
Show Column Average
The column average selection will average all the data in the selected column and display the resulting value in this column at the end. For example this could be used to quickly display the average brake stop distance from a file of many runs.
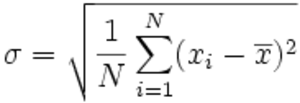
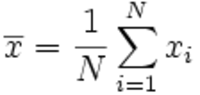
Standard Deviation
The standard deviation selection will calculate the standard deviation of all the results in the selected column and display the result and the end of the selected column. This is very useful data as it gives an idea of the consistency of the all the results.
Standard Deviation is calculated in the following way:
|
1) calculate the average of all the values Which means take the sum of all the values from sample 1 to sample N and multiply it by 1 over the number of samples. |
|
|
2) Then calculate the sum of the square of the differences between each point and the average, multiply by 1 over the number of samples, then square root: |
.png?revision=1) |
.png?revision=1)
Available Parameters
The list of parameters available for selection as column titles not only contains the standard VBOX channels and any available CAN channels, it also contains some other useful channels:
- Run number (Run num) – This number increments for each new run (one section of data between the test start and end conditions).
- MFDD – The Mean Fully Developed Deceleration, is usually taken as the average deceleration of a brake stop taken between 80% and 10% of the test start speed.
- Corrected distance (Corrtd dist) – The distance from the point at which the brake trigger is activated to the test end speed, corrected by multiplying the total distance by the ratio of the square of the trigger speed to the nominated ‘corrected distance start speed’. The ‘corrected distance start speed’ can be set to a chosen value or the nearest 10km/h or mph. This is set on the options page of ‘Test Set-up’.
- File time – The time that the scanned file was recorded.
- Trigger speed – Shows the speed at which the Trigger occurred.
- Save run – With this selected, the logo of a disk will appear at the end of each run. An individual run on the Report Generator display can then be saved as a ‘.vbo’ file.
- Include box – This will place a tick box on the display screen for each run. This enables selected runs to be included or excluded from column average totals and when saving the results.
- Graph run – A logo of a graph appears at the end of each run. On clicking this icon, the Graph screen automatically opens, displaying this run.
- Average Longitudinal Acceleration (Avg longacc) – This column will display the average Longitudinal Acceleration, calculated by the following formula:
- a = (v2 –u2)/2s
- Where a is acceleration, v is the final speed, u is the initial speed and s is the distance travelled.
- Vmax – This displays the highest speed achieved in the run.
- Centre Line Deviation- This is a calculated channel of vehicle deviation from a specified centre line. The centre line is configured by setting a heading in ‘Tools’ – ‘Centre line deviation setup’
- User Text – This enables the user to enter text that can be included in the results table. It can also be used as the filename for Auto-saved files.
- Relative Height – Calculated from the vertical velocity channel (when available), this gives the change in height from the start of the run. Over shorter tests, this can be more accurate than the standard Height channel.
- File Name, Serial Number, File Date – Inserts these details from the file into the results table, for easier reference.
- Time Since Midnight – This measure of time can be used easily with Maths Channels and Memory Stores. In particular, it can be used to calculate important information such as time between brakestops.
- Test Name – This inserts the name of the .rcf file used to generate the results table. This is particularly useful when exporting results tables for analysis in other software or when using the batch test facility to perform multiple different tests on the same file.
- Radius Of Turn – Displays the radius of turn as calculated from the GPS data. The options selected in the “Radius of Turn Setup” tool also apply in RepGen.
- Maths Channels – Any maths channels defined by the user can also be entered as a column header.
Defining Test Conditions
The next step is to define the test conditions. These define the conditions under which a test sequence will start and stop. They also allow the user to select how the report data is compiled, for instance whether an extra report line is added for a given speed, distance or time.
The following section explains each part of the test setup in more detail.
Start ConditionsThese define the conditions under which the test will start. The start condition options are:
These conditions can be combined with an OR relationship, meaning that if you activate all of speed, brake trigger activated and the cross start/finish line option, the test will start when any one of the conditions are valid. The trigger options can be enabled or disabled using the tick box on the left of each trigger parameter. If a box is ticked, the parameter will be used to trigger the test.
Three filter options are available for the speed condition:
These are used with the speed in an AND relationship; if, for example, the increasing option is enabled, the test will only start if at least one of the trigger conditions is met and the speed is increasing. If you are having problems triggering a test, set this to ‘either’. There is also a facility to make the computer beep when the start condition is met. |
.png?revision=1) |
.png?revision=1)
‘Speed Greater Than’ Filter
This can also be used to filter out 0kmh to 0km/h runs that do not go over the stated speed. This is particularly useful for removing small movements in between proper acceleration runs.
Brake Trigger Activated
The “Brake Trigger Activated” option allows the test to begin when the brake trigger is pressed. If the associated speed range is set to non-zero values, the brake trigger will only cause the test to start if the speed is within the specified range. This filter will enable the software to ignore any cases of a brake stop that does not start above the user-specified speed. If the speed range has zero values for its limits, the test will start when the trigger is pressed, regardless of the speed.
Maths Channel Start Condition
The test can also be started using a Maths channel threshold start condition. A greater than ‘>’ and less than ‘<’ option dictates when the test will start. To enable one of these options click the small tick box and enter a threshold value in the box to the right. For more information on the Maths Channel please refer to the ‘Maths Channel’ chapter of this manual. You can use this to start a test from any logged channel by making the maths channel equal to the desired channel.
End ConditionsThe end conditions are similar in operation to the start conditions. They define the conditions under which a test will end. There are six parameters that can be configured to end the test. They are all related by an OR relationship, so if any one of the conditions are met during the test, the test will end. As with the start conditions, a filter is available for selecting whether the speed should be increasing, decreasing or either.
The “End of acceleration” condition occurs whenever the longitudinal acceleration is less than -0.1G for one second. The longitudinal acceleration is automatically smoothed for the purposes of this calculation. This feature allows tests such as acceleration runs to be analysed without prior knowledge of the vehicle’s final speed. |
.png?revision=1) |
Line ConditionsThe start and end conditions will each add a line to the test report when a condition is met. The line conditions may be used to add useful data to the report between the start and end events.
There are a number of conditions that can be configured to add lines to the test report, as listed in the table below.
Test lines can also be created using the Maths channel threshold conditions. To add a maths channel test line enable the desired maths channel condition and enter a threshold in the relevant box. A channel must then be defined in the Maths Channel, please refer to the Maths Channel section of this manual for further information.
The “Allow Reset” option on the maths channel line conditions allows a new line to be generated each and every time that condition goes from being invalid to being valid. If this option is not enabled, a result line will only be generated the first time that condition goes valid in any given run. |
.png?revision=1) |
| Condition | Operation if enabled |
|---|---|
| Speed line | A new line will be added at user defined speed intervals, for example every 10 km/h |
| Distance line | A new line will be added at user defined distance intervals, for example every 10 m |
| Time line | A new line will be added at user defined time intervals, for example every 0.2 s |
| Brake trigger event line | A new line will be added upon activation of the brake trigger |
| Start/finish line | A new line will be added as the start/finish line is crossed |
| Finish line | A new line will be added as the finish line is crossed |
| Split line | A new line will be added as a split line is crossed |
Options
The options tab contains test setup configuration options.
Comments Section SizeThis option sets the size of the area set aside for test comments at the beginning of the test data. Acceleration UnitsThis option allows the user to select the units of acceleration from a choice of either G, m/s2 or ft/s2. Time FormatFrom this option, the user can select whether to have time displayed in seconds only format (ss.ss), or in minutes and seconds (mm:ss.ss). Autosave DataWith this option selected the displayed report data is automatically saved to a new file. New File for Each TestThis option dictates whether a new file is created for each test or whether all tests are saved to the same file. Row CountThis option allows you to increase the maximum line limit with the Report Generator screen. Smaller line limits will decrease the time for some operations (such as resetting data) and are generally more suitable for less powerful machines. The default setting is 1500 lines. |
.png?revision=1) |
Continuous Testing
This option will allow the software to continue scanning for more runs after completing the first.
Hide Start Condition Line
This function will cause the start condition line to be omitted from the report. This is useful when creating a report that only has the end result on each line, particularly when carrying out multiple brake stops and using the column average function to work out the average stopping distance. This feature is usually combined with the ‘Don’t leave a line between tests’ option and an ‘include box’ in one of the columns.
Hide End Condition Line
This function will cause the end condition line to be omitted from the report. It can also be set only to omit the end line if the speed has exceeded a specified value during the run.
Hide Line Condition Line
This function will cause any line condition result lines to be omitted from the report. This is useful for removing lines which are required to carry out the test, but are not actually required in the results table.
Don’t Leave a Line Between Tests
This suppresses the blank line created after each time the end condition is met.
Hide Test Resets On Over/Under Speed
With this option enabled, the software will not display any occurrences of data fitting the start conditions but not the end conditions, for example going over and then back under the start speed whilst preparing for an acceleration run. This is very useful for eliminating unwanted data between valid runs.
Generate Lines Only During Brake Trigger
This switch causes the software to only display data lines when the Brake/Event marker switch is activated. It should be used in conjunction with the Start and End conditions also set to ‘Brake trigger’.
In this mode the start condition will occur when the Brake/Event marker switch activates and the End condition is met when the Brake/Event marker switch is de-activated.
This can be used for compiling data for tests such as a coastdown tests, see Application notes on the website or CD for guidance on ‘Coastdown Tests’.
MFDD Settings
The MFDD (Mean Fully Developed Deceleration) settings are set with these options. The MFDD can be calculated from percentage values of the start speed or from exact speeds, depending on what values are set. See the section entitled ‘Brake Testing – Explanation and Tips’ for more details.
Corrected Distance
This option allows the corrected distance to be calculated either from a nominated speed or from the nearest round 10km/h value.
If a brake trigger is fitted, this is the distance from the point at which the brake trigger is activated until the vehicle reaches 0km/h. It is corrected by multiplying the total distance by the ratio of the square of the trigger speed to speed at this nominated or the nearest 10km/h speed.
The Corrected Distance is used to compare the distance from triggered brake stops of different runs. To combat the problem of human error resulting in the brake pedal being pressed at a different speed every time, the Corrected Distance corrects the data to a known speed thus allowing accurate data comparison.
Accel Smoothing Level
This allows the amount of smoothing on the longitudinal and lateral acceleration calculations to be adjusted. As a rule of thumb, we tend to use level 2 for 20Hz data, and level 12 for 100Hz data.
Creating Custom Test Setup Profiles
Often you will want to customise a test profile to the settings required for a particular test, or re-use the same settings. Custom test profile settings can be saved in place of one of the five preset profiles. For example if after modifying the Accel Test settings and selecting column titles as desired, selecting ‘Report Generator à Default Test 4 à Assign Current Test Settings’ then choose a name and location for the configuration file and click the ‘Save’ button. The test name in the toolbar will change to match that of the configuration file.
One of the five default test setup profile icons can be assigned to the test if desired, using the ‘Assign icon’ option in the drop-down list.
The screen shot below shows an example of the first preset test now being set to a custom test called Racelogic1.
To restore a default test, select the ‘Return to default’ option from the tests menu.
Loading and Saving Custom Test Profiles
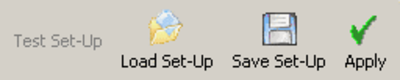
The ‘Load Set-Up’ and ‘Save Set-Up’ buttons at the top of each test setup window allow the test configurations to be saved and then re-loaded.
.png?revision=1)
Set-up change warning
|
When making changes to an un-saved set-up, VBOX tools will flash up dialogue box to give the user an option to save the existing set-up before the changes are applied. |
|
.png?revision=1)
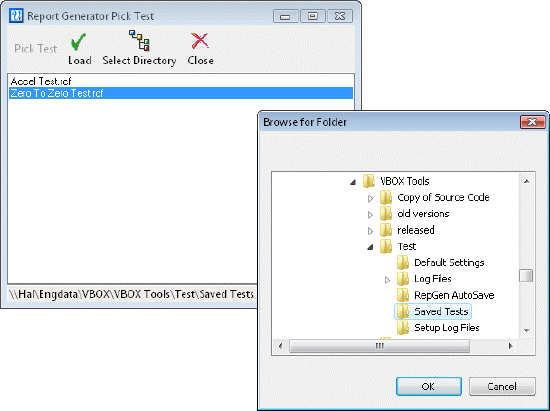
Pick Test
|
Clicking ‘Pick Test’ or pressing ‘F4’ brings up a window that contains a list of previously saved custom test profiles. These profiles are saved in the PC’s directory structure for ease of access. From the ‘Report Generator Pick Test’ window, click on ‘select directory’. This will enable you to browse the directory structure for the folder where your test profiles are saved. Once the required folder is located, press ‘Enter’ to open this in the ‘Report Generator Pick Test’ window. The test profile can then be selected from the list. |
 |
Adding and Removing Test Profiles
Click the ‘Add Test’ icon to open a browse window then search for your test setup file and click ‘Open’ to add this setup to the list.
To remove a test from the list, select it with the mouse or the up and down arrows then click the ‘Remove Test’ icon to delete the highlighted file from the Pick Test window.
Start / Finish & Splits
|
The Report Generator screen includes a feature in its toolbar that allows you to load split files into the software, or to clear any splits previously set in the file. This feature can be very important because it allows you to load a file into the Report Generator only and still use split lines, as opposed to having to use the ‘Load All’ feature. |
|
.png?revision=1)
Please note, however, that it is not possible to set split lines within the Report Generator itself – to do this, the file will need to be loaded into software using the ‘Load All’ button, after which split points can be set normally (see ‘Start / Finish Lines and Splits’ section for more details).
Batch Processing
There are two forms of batch processing: batch run and batch test.
Multi-File Test
It is possible to process runs from multiple files at the same time in the Report Generator screen. To do this, the test setup must be configured before loading the files. Once the test has been configured as desired, click the arrow next to ‘Load Into RepGen’ and select the option ‘Multiple Files. Select the required files, and the Report Generator will process them automatically.
NB: The files to be processed must all be within a single directory.
Multi-Part Test
The multi-part test option allows different types of test to be conducted in sequence, without the need for user-intervention. This can be useful for performing a variety of tests in a single session, or for performing equipment calibration runs and then feeding the calibration results into the subsequent test. In addition to the full range of test setup options, the setup files can contain screen layouts. This allows the Report Generator to change which parameters are displayed – and the format and position in which they are displayed – to show information in the clearest possible manner during each part of the test.
Multi-part tests are configured by selecting a series of existing or new RepGen test setup files and arranging them in the desired order. These files can include all of the normal test settings, including start, end and line conditions, speed columns and column headings, as well as screen settings.
Before it can be used, a multi-part test configuration must be saved in the format .btf (“Batch Test File”). It can then be subsequently reloaded if desired, however the component .rcf files will also need to be available in their original directories with their original names.
Once the multi-part test has been configured and saved, it can be used simply by loading a file (post-processing mode) or connecting a VBOX (real time mode) and either clicking the “Multi-part Test > Run” button or pressing F6.
Speed Columns
The use of Speed columns in Report Generator is to allow interim time values to be displayed across the screen in columns rather than down the screen in rows. See the table below for an example of the use of Speed Columns:
Acceleration example
Four 0-60km/h runs have been performed and the times at 10km/h intervals have been generated:
| Run num | 0-10 | 0-20 | 0-30 | 0-40 | 0-50 | 0-60 |
|---|---|---|---|---|---|---|
| 1 | 0.39 | 0.71 | 1.02 | 1.48 | 1.83 | 2.2 |
| 2 | 0.48 | 0.8 | 1.15 | 1.45 | 1.74 | 2.13 |
| 3 | 0.47 | 0.81 | 1.16 | 1.49 | 1.81 | 2.15 |
| 4 | 0.6 | 0.99 | 1.4 | 1.88 | 2.88 | 3.33 |
| Avg=0.49 | Avg=0.83 | Avg=1.18 | Avg=1.57 | Avg=2.06 | Avg=2.45 |
If speed columns were not used, then each time result would be on a separate row, making it impossible to average each speed range:
| Run num | Speed | Time |
|---|---|---|
| 1 | 0 | 0.0 |
| 10 | 0.39 | |
| 20 | 0.71 | |
| 30 | 1.02 | |
| 40 | 1.48 | |
| 50 | 1.83 | |
| 60 | 2.2 | |
| 2 | 0 | 0 |
| 10 | 0.48 |
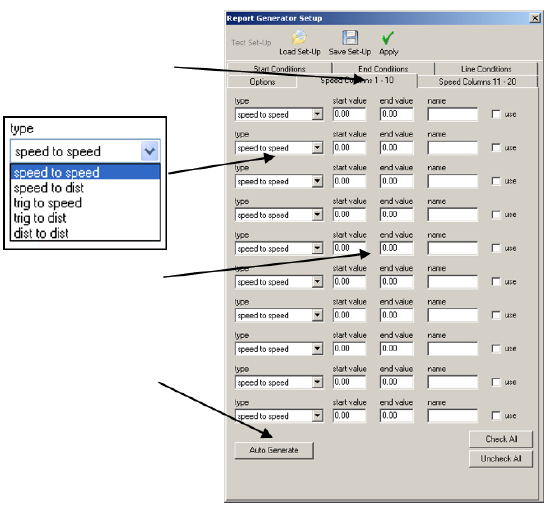
Configuring Speed ColumnsThe individual Speed Columns are configured from within the normal ‘Test Setup’ in Report Generator. There are two tabbed pages for the speed columns, 1-10 and 11-20. Each Speed Column generates a result which is based on the time between two events. These two events can be selected from a pull down list: The start and end points for each Speed Column can be configured by manually entering the value Or by using the Auto Generate function. NB: Even though you may have set an individual Speed Column to a 0-60 test, you still have to set the overall Test Start and End conditions as normal using ‘Test Setup’. For example, if you are doing a test from 0-100 with 10 speed columns, then set Start Conditions to 0 km/h, End Conditions to 100 km/h, then set 10 speed columns for the 10 increments in-between.
|
 |
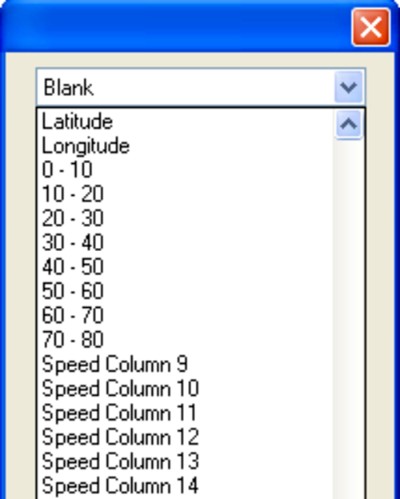
Assigning a Speed ColumnTo assign a results window column to one of the Speed Columns, click the column header and then select one from the pull down list.
NB: If the name of the Speed Column does not appear in this list, then make sure that the ‘Use’ box has been ticked in the Test Setup.
NB: Some features such as ‘highlight run’ do not work in conjunction with speed columns. |
|
.jpg?revision=1)
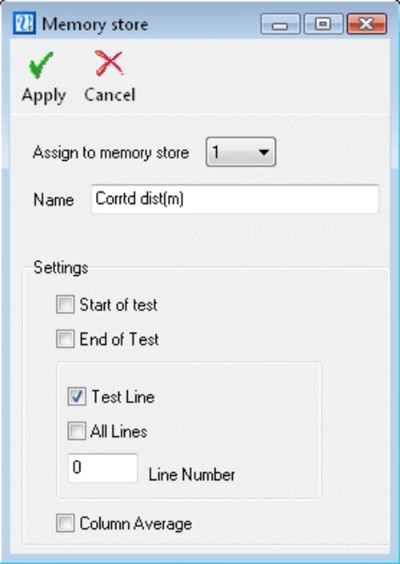
Memory Stores
Memory stores are permanent memory locations used to store results form a test, so that they can be carried over to another test. The value in the Memory Store is a permanent value, so it is not lost when the software is shut down, or when a new test starts. There are 10 memory stores in total and data is allocated in one of three ways:
|
|
|
|
|
|
|
|
.jpg?revision=1) |
.png?revision=1)
.jpg?revision=1)
.jpg?revision=1)
Memory Store example
In this example, a wheel speed encoder is fitted to measure the wheel slip. The wheel speed encoder outputs a set number of pulses per revolution, but because the tyre diameter can vary, the exact calibration of the encoder is required first.
This memory store can then be used as a multiplier in subsequent tests to transform the Wheel speed encoder output into a calibrated wheel speed output in km/h. |
|
.jpg?revision=1)
Memory Stores from Test Lines
When choosing to assign a column’s line condition result value to a memory store, it is possible to assign this from either a specific test line for which this applies, or from every new valid line condition.
To assign a specific line result to a memory store, click “Assign value to memory store” from the Report Generator results table, as explained above. The Memory store dialogue box presents the option to choose a specific line number. ensure the Test Line box is checked and then manually enter the line number to be assigned.
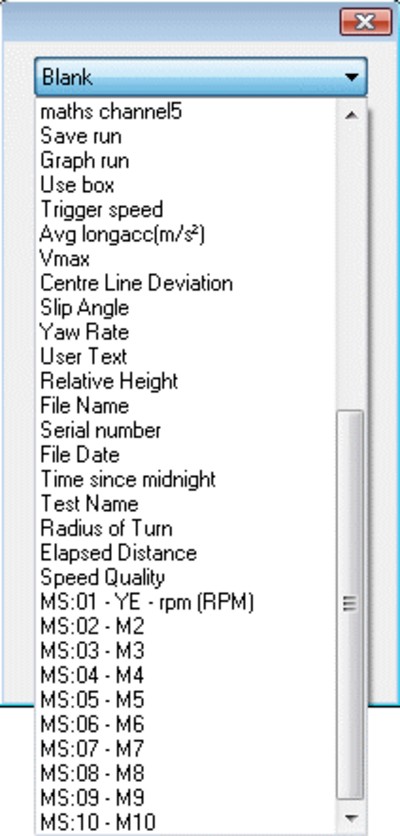
Memory Stores as Column Headers
Any of the 10 memory stores can be selected as a column header in a results table, useful for when it is desirable to know the value held in the memory store at each test line. To select a memory store as a header, left click on the column header in the table and a drop down menu of available channels will be given. Scroll down to the required memory store, select this and then click OK.
|
|
|
.jpg?revision=1)
.jpg?revision=1)
Report Generator Maths Channels
The Report Generator toolbar contains a ‘Maths Channel’ icon, which can be used to create up to five Maths channels for use with the Report Generator. As well as displaying the results of mathematical expressions with every line of information created by the Report Generator, these Maths channels may be used as start conditions or line conditions.
See the section ‘Maths Channel’ for more details..png?revision=1&size=bestfit&width=120&height=70)