18 - VBOX Tools Test Configurations
Centreline Deviation Tests
The VBOXTools software includes the capability to perform centreline deviation tests in both live and post-processed modes. By knowing the heading of ‘straight ahead’, the software can work out any deviation from the reference line. This is done using the Speed and Heading parameters, and as such is very accurate (within a few cm) for tests of short durations (<60s). This applies to all VBOX’s.
Centreline Setup
To set the centreline heading, first select ‘Centre line deviation set-up’ from the ‘Tools’ menu, which will open a new window within the software. A known heading can then be typed in, and set for use by the software by clicking the ‘Apply’ button.
Determining a Centre line heading
If the centreline heading is not known, it can be determined either in live mode or from a logged file where the user has carefully driven down the centreline without any deviation.
|
In a logged file, simply load the logged file into the software, select Graph Screen, then turn the heading channel on and use the Graph Measure Tool to find the average heading over the relevant portion of the logged file (see the section ‘Graph Measure Tool’ for more details). To achieve the most accurate heading value for the centre line of your test track average the heading reading on a number of runs down the centre line of the track. The heading value recorded by a VBOX is more accurate at faster speeds, so this test is best done over 30kmh.
In live mode, the centreline heading can be determined from within the centre line deviation set-up screen itself. With a VBOX with brake trigger connected to the computer, simply click the ‘Auto Sample’ button and drive along the centreline. Then press the brake trigger once to start sampling, and once more to stop sampling. The centre line deviation set-up screen should then display an averaged centreline heading. The ‘Auto Sample’ averages are cumulative – so that you can make a more accurate measurement by auto sampling the same line several times by starting and stopping the auto sample feature as required, and the software will average over the course of all of the runs. For this reason, it is essential that you click ‘Clear Average Heading’ to remove any previous data before setting a new centreline. |
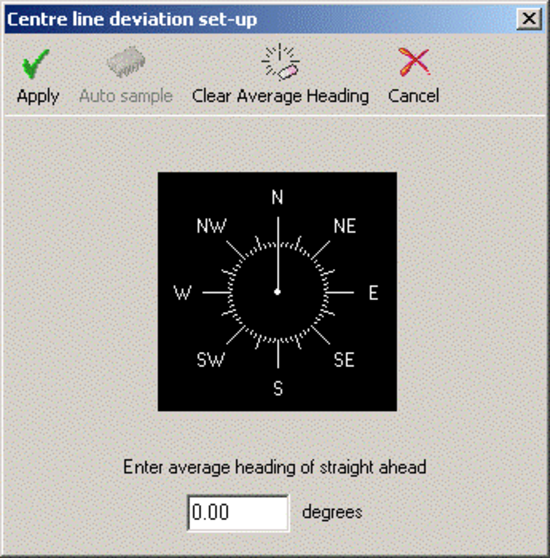 |
Once the centreline heading has been set, click ‘Apply’ to close the screen and use this heading, or ‘Cancel’ to close the screen without using this new heading.
It is important to measure the average heading as accurately as possible. If your straight is short, then perform the process more than once. Once this has been determined accurately, the results should be accurate to a few centimetres.
Viewing Centreline Deviation
Once a centreline has been set, centreline deviation can be viewed in the Graph Screen, Report Generator and Live Windows. In all modes, the centreline deviation will be set to zero at the start of a file and whenever a brake trigger is pressed.
To view the centreline deviation in the Graph Screen, simply load a suitable logged file into the VBOXTools software, click the ‘Graph’ icon and select the centreline deviation channel for display.
In the Report Generator screen, the centreline deviation can be set as a column heading as normal and a live window created by right-clicking that column heading. A Live Window display of centreline deviation can also be created in the normal way, by clicking ‘New Window’ from the main menu and then selecting ‘Centreline Deviation’ from the list of ‘Calculated Channels’.
Brake Testing – Explanation and Tips
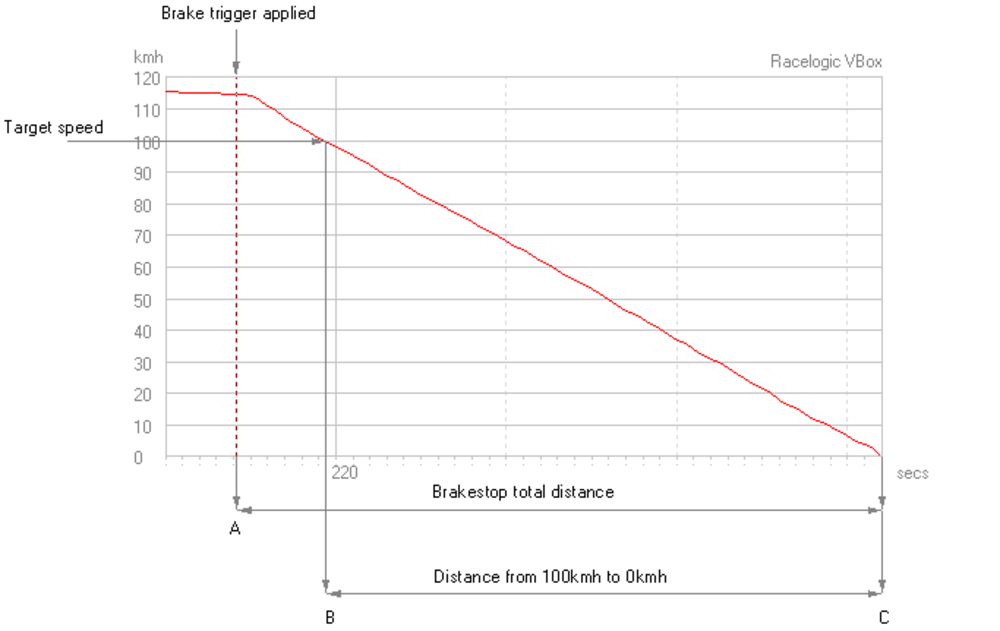
A brake test is a deceleration test carried out between two speeds. Data taken during the test is used to calculate the time taken and distance travelled. A trigger can be used to measure the point of activation of the brake pedal.
.png?revision=1)
In the example above, the aim of the test was to examine the braking performance between 100km/h and 0km/h. A brake pedal trigger was used, which showed a trigger activation speed of 116km/h. The target speed range was selected for analysis within the Report Generator by setting the relevant speeds for the Start conditions and End conditions.
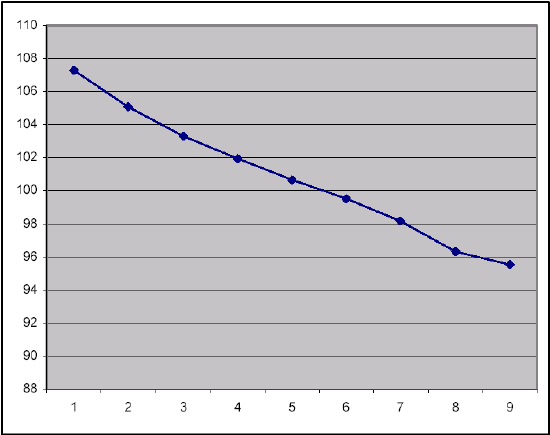
A very repeatable and accurate result from such a brake test is the distance from 100km/h to 0km/h. As a VBOXII samples every 50ms, the precise point at which the speed hits 100km/h will not be known. This can be seen by looking at the adjacent graph, which shows the speed samples around the 100km/h target speed. The first sample before 100km/h is 100.8km/h and the next sample is 99.7km/h. Even with the 100Hz update rate of a VBOXIII, the sample point data would not be accurate enough.
|
The VBOX software calculates the precise time at which the car passed through 100km/h by linear interpolation; it also calculates the distance at this point. This method eliminates some errors caused by the effect of vehicle pitch, because most of the pitching has already taken place before the target speed is reached. The settling of the car after it stops is ignored in the calculations, because this is detected by the software as a ‘bump’ at the end of the speed trace and removed. The distance calculated using this method is very accurate and repeatable. This is more commonly used for tyre testing as all the braking response time variables are eliminated. |
 |
Using a Brake Pedal Trigger (Not Applicable to VBOXII Lite)
The distance between the point at which the pedal was pressed and the vehicle reached 0km/h can also be measured. This gives an overall indication of the response time of the braking system, as well as the performance of the tyres. This is generally known as the ‘Stopping distance’.
This method is heavily dependant on the speed and accuracy of the method of determining when the brake pedal was pressed, as well as the speed latency of the speed measurement system.
A VBOXII measures speed at a sample rate of 20Hz, which is every 50ms, and in this time the vehicle in the example above could have travelled 1.6m. To achieve greater accuracy than this the brake pedal trigger is scanned much quicker than every 50ms. Even though the VBOXIII at 100Hz can measure speed at intervals as low as every 10ms it also requires the brake trigger to be scanned to give better accuracy.
Both the VBOXII and VBOXIII have a special counter that counts up in between the samples. When a trigger activation is detected the counter is stopped and the time recorded on it is used as the ‘Trigger event time’.
The VBOXII and VBOXIII must be set to record Trigger event time, which gives the small fraction of time between the pedal being pressed and the previous 50ms (VBOXII) or 10ms (VBOXIII) sample. This time can then be automatically included in the calculation to add the extra distance covered during this small period of time. Trigger event time is automatically present in the serial data stream and hence available for on-line brake testing, but it must be enabled and logged to be present in the log file and hence available in post processing calculations.
In addition there is a slight latency in the speed calculation of the GPS system, which does not matter unless you are referencing it to an external source. However, a brake trigger is an external source so the latency is taken into account. When the VBOXTools software uses a brake trigger to calculate this distance and the Trigger event time has been logged, this latency is automatically taken into account. The VBOX does this very well and an incredible level of consistency and accuracy can be found when doing brake stops with an external trigger.
Dynamic Modes
Whenever conducting brake testing on a VBOX the dynamic mode must be set to ‘High’.
The VBOXIII has three dynamic modes that apply different levels of SMI smoothing at source inside the GPS engine. These three levels of dynamic mode are GPS optimizations found in the GPS tab of the VBOX Set-up screen.
The modes available are ‘High’, ‘Normal’ and ‘Low’. At higher levels the response times are faster but the data is smoothed less. At lower levels, greater smoothing occurs at the cost of reducing the response times.
Rock Back
|
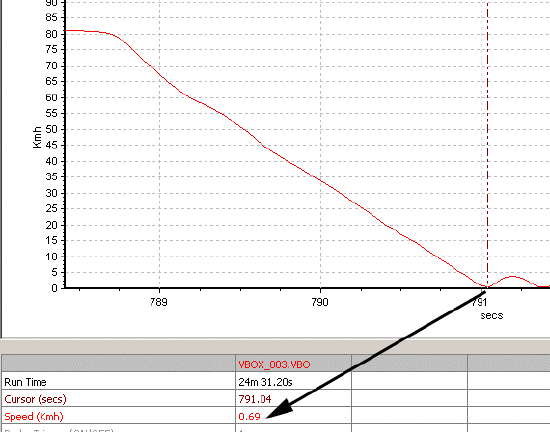
At the end of a brake stop, the car often rocks backwards as the suspension settles. To make sure this does not affect the result, the default setup end speed when you select ‘Brake Test’ or ‘Trigger Test’ profiles in the Report Generator screen is set to 0.8km/h, which eliminates this in 99% of cases. With rock back, the stopping distance above is 25.23m. Without rock back, the stopping distance is 25.15m. During a high-g stop, setting the end speed at 2km/h or 0.5km/h makes very little difference to the total stopping distance. This is because the vehicle is travelling very slowly at this point in time, less than 3cm per 20Hz sample. |
 |
Examples (without rock back) braking from 80km/h:
| Cut-off speed (km/h): | Distance (m): |
|---|---|
| 0.5 | 25.15 |
| 1.0 | 25.15 |
| 2.0 | 25.12 |
| 5.0 | 25.08 |
| 10.0 | 24.79 |
Auto Corrected Distance Start Speed
If a brake trigger is fitted, the ‘corrected brake stop distance’ is calculated as follows: the distance between the point at which the brake trigger is activated and the point at which the end speed is reached is calculated, then corrected by multiplying the total distance by the ratio of the square of the trigger speed to a nominated start speed.
In the Report Generator screen the nominated start speed for this calculation can be directly set, or the software can be set to use the nearest rounded 10km/h point. For example if the trigger speed was 104km/h then 100km/h would be the nominated start speed for the corrected brake stop distance.
In the Multi Function Display, this nominated start speed is always the nearest 10km/h point.
MFDD – Mean Fully Developed Deceleration
This deceleration figure is used to show the maximum deceleration figure a vehicle can achieve. It is usually the deceleration between 80% and 10% of the trigger activation speed, the time at which the vehicle is loaded up and braking at its highest achievable level.
The MFDD is calculated by the following formula:
MFDD = ((v_08)² – (v_01)²) / (25.92 * (s_01 – s_08))
Where:
v_08 is the speed at 80% of the brake trigger activation speed.
v_01 is the speed at 10% of the brake trigger activation speed.
s_08 is the distance at which the speed is v_08.
s_01 is the distance at which the speed is v_01.