Mining Test - Time and Motion
The Time and Motion plugin for VBOX Test Suite gives you the ability to generate reports to view how queuing time would change as a result of simulated speed limits and if there would be any occurrences of the excavator waiting.
The plugin includes features such as algorithms for queuing time and inputs for simulated maximum speed limits and load/dump locations.
Ribbon - Test Setup
The Time and Motion plugin as a unique Test Setup ribbon, from which you can configure the test.

Test Section

Configure
Report
Maths Channel
Save Settings
Click on the Save Settings button to save the current test setup and add it to the Saved Settings area in the Add Test window.
The test will also be added to the list under the Mining button on the Home tab for easy access.
Export
Gate Section

Add Gate
 |
Click on the Add Gate button to add a virtual gate to the chart and map at the point of the cursor. Gates are indicated by green lines. The currently selected gate will be indicated by a blue line. You can now use the gates to define start and/or end conditions. |
|
Note: Opening a plugin (either as a new tab or overwriting an existing one) will clear all set gates, requiring you to redefine the gates before you amend the test configuration to set start/end conditions. |
Gate Name
Width
Rename
Delete
Delete All
Export
Import
Data Column Section

Add
Channel
When you select a column header in the Test Results area, the channel name will be displayed in the Channel box (the top box in the Data Column section). Some columns will have required channels and cannot be changed, but if you can change the channel, the Channel box will become a drop-down list with the available channels.
|
|
|


Result Condition
Sort Ascending
Sort Descending
Run Section

Select All
Deselect All
Session Section
Edit Data


Click on the Edit Data button to open the Session Data window and add various vehicle and test information, such as:
Time Zone
Select the relevant time zone.
Help Section
Help

Click on Help to automatically open an Internet browser and load the relevant section of the User Guide on the Racelogic Support Centre.
| Note: This page will only be displayed if there is a valid internet connection. If there is no valid internet connection, a cached version of the relevant section (from the last software update) will be presented in PDF form. |
WorkSpace
Map

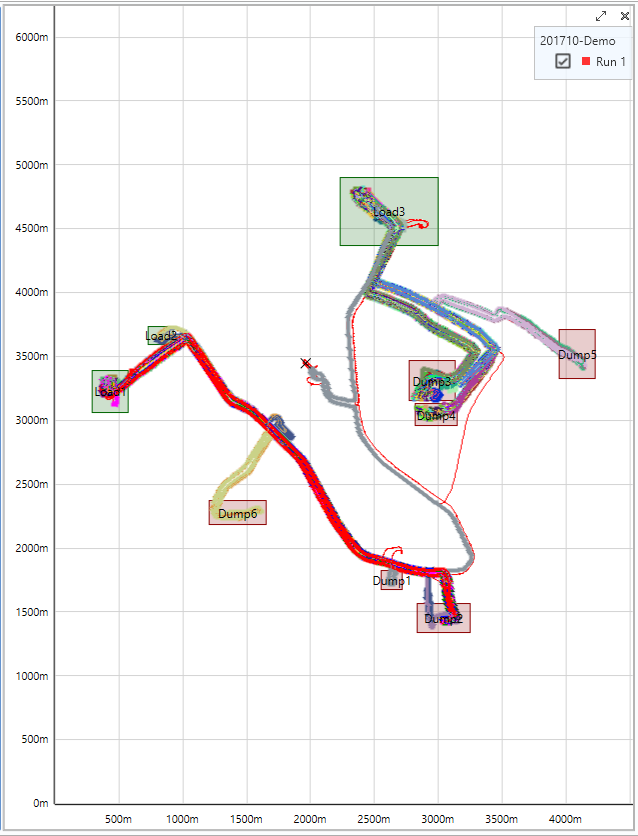
Add Region
On the Map, you can define load/dump locations by selecting Add Region. This allows the software to detect whether a vehicle is loaded or unloaded based on regular movements.
Ensure that the region is placed correctly so as not to miss any areas in which load status may have changed. For instance, make sure all dump locations are captured as dump regions and all load points are captured as load regions. To reduce the chance of error, avoid load/dump regions at traffic hold points, such as intersections.
You can also rename load/dump locations as the relevant circuit will be represented in Results and the Report as “Load”-“Dump”-“Load”.
Test Settings
If you are creating a new test, the Settings window will open when you add the new test. This is where you can define the test parameters.
If you have already added an Accel test and you have it open, you can click on the Configure button to open the Settings window to define or amend the test parameters.

Simulated Maximum Speed Limits
Load Area Approach Speed (km/h)Specify the approach speed to the load area in km/h. Use the arrow buttons next to the value box to increase/decrease the speed or type the required speed directly into the value box. Speed Limits (km/h)Specify the required speed limits. Use the arrow buttons next to the value box to increase/decrease the speed or type the required speed directly into the value box. Click on the + button to add another speed limit. Click on the X button next to set a speed limit to delete it. |
 |
Report Settings
Minimum number of runs for inclusion in reportSpecify the minimum number of runs for the test to be included in the report. Use the arrow buttons next to the value box to increase/decrease the number of runs directly into the value box. Standard DeviationSpecify the standard deviation for the report. Use the arrow buttons next to the value box to increase/decrease the deviation or type the required value directly into the value box. |
 |
Advanced
Minimum Load Time (s)Specify the minimum load time in seconds. Use the arrow buttons next to the value box to increase/decrease the load time or type the required load time directly into the value box. Minimum Dump Time (s)Specify the minimum dump time in seconds. Use the arrow buttons next to the value box to increase/decrease the minimum dump time or type the required minimum dump time directly into the value box. Maximum Load Speed (km/h)Specify the maximum load speed in km/h. Use the arrow buttons next to the value box to increase/decrease the speed or type the required speed directly into the value box. Maximum Dump Speed (km/h)Specify the maximum dump speed in km/h. Use the arrow buttons next to the value box to increase/decrease the dump speed or type the required speed directly into the value box. |
 |
Test Results Area
Rename File
Edit Session Data
Result Columns

The Test Results area has the following default columns:
| Run | Indicates which run number the results relate to, with run one being the first run completed. There is also a selection box that, when ticked, includes that run in the graph and into the Average/Max/Min/Standard Deviation calculations. Once selected, a coloured square will appear to indicate which colour this run is displayed as on the graph.
|
|
| Cycle | The start and end location of the journey cycle. | |
| Depart Dump | The time at which the vehicle left the Dump area. | |
| Journey Time | The total time of the journey. | |
| Queue Time | The total time spent queueing in this cycle. | |
| Load Start | The start time of the load. | |
| Queue Count | The total number of times the vehicle stopped while queueing. | |
| Queue @ 50 | The projected queue time if the vehicle travelled at 50 during the cycle. | |
| Queue @ 40 | The projected queue time if the vehicle travelled at 40 during the cycle. | |
| Queue @ 30 | The projected queue time if the vehicle travelled at 30 during the cycle. | |
| Queue @ 20 | The projected queue time if the vehicle travelled at 20 during the cycle. |
The software will automatically add columns based on the configured settings.