Corner Analysis Plugin Application Guide
Introduction
The ‘Corner Analysis' test is a plugin for the VBOX Test Suite software designed for VBOX Mining users.
This Application Guide will guide you through key inputs to achieve results in the Corner Analysis Plugin. The plugin will output a report displaying an analysis of operator driving style for each corner.
Ribbon Bar
The ribbon bar at the top of the window has a selection of large buttons, which fall under 3 main sections:
Help
Pressing this 'Help' button will automatically open an internet browsing window and load the relevant section of the Racelogic Support Centre. This page will only be displayed if there is a valid internet connection.
Home
Add Test
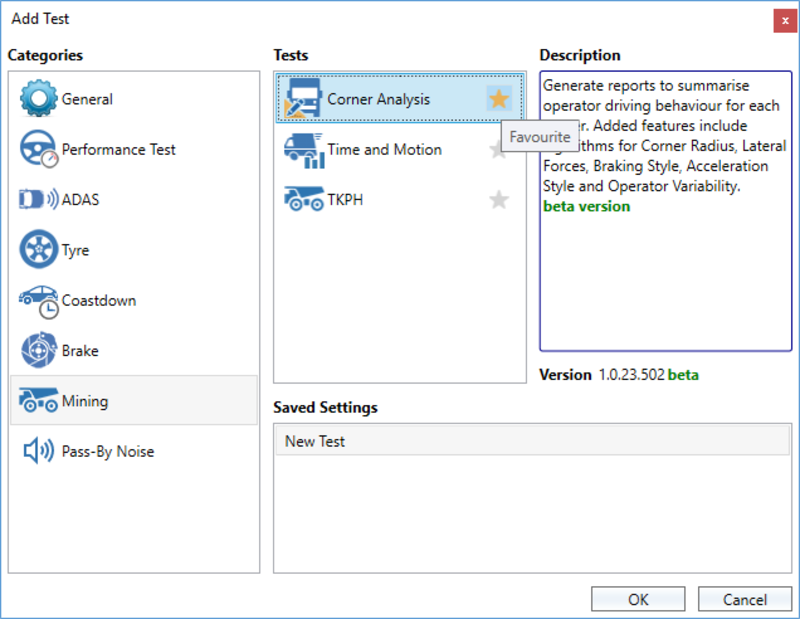
For your first test, click on the ‘Add’ button in the ribbon bar.
This will list the tests available under 'Categories'. Select the 'Mining' category, click 'New Test' and click 'OK'.
It may also be useful to add a certain test to your favourites by clicking on the star and ensuring that it is coloured in. This will ensure that the mining icon will be present in the ribbon bar.
New Test
When the Mining icon  is present under the 'Home' tab in the ribbon bar, you can open a new or saved test by clicking on the icon and selecting from the dropdown.
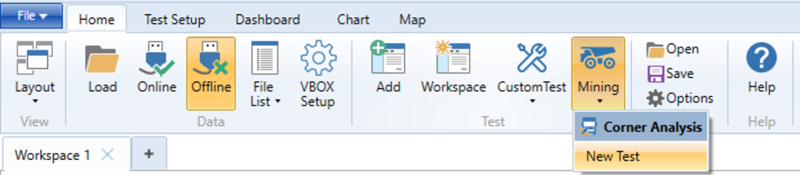
To save a settings .vbts file to your documents, click on 'Save' near 'Options'. This settings file will save gate locations for easy loading onto any .vbo file.
Test Setup
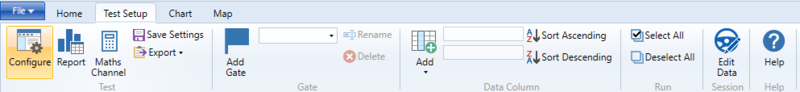
To save a settings file to be listed under the Mining dropdown menu, click on 'Save Settings' near 'Options'. This settings file will save gate locations for easy loading onto any .vbo file.
When you open a new test, you will be prompted to enter Test Configuration information. This can also be accessed by clicking the 'Configure' button under the 'Test Setup' tab in the ribbon bar.
Test Configuration
Selecting the 'Configure' button will display a pop up window where the user can define the parameters of the test. To save a test configuration file (.vbts) to be stored in your files, click on 'Save Settings' near the 'Configure' button.
Use the up and down buttons to the right of the parameters to Expand and Collapse the parameter headings.
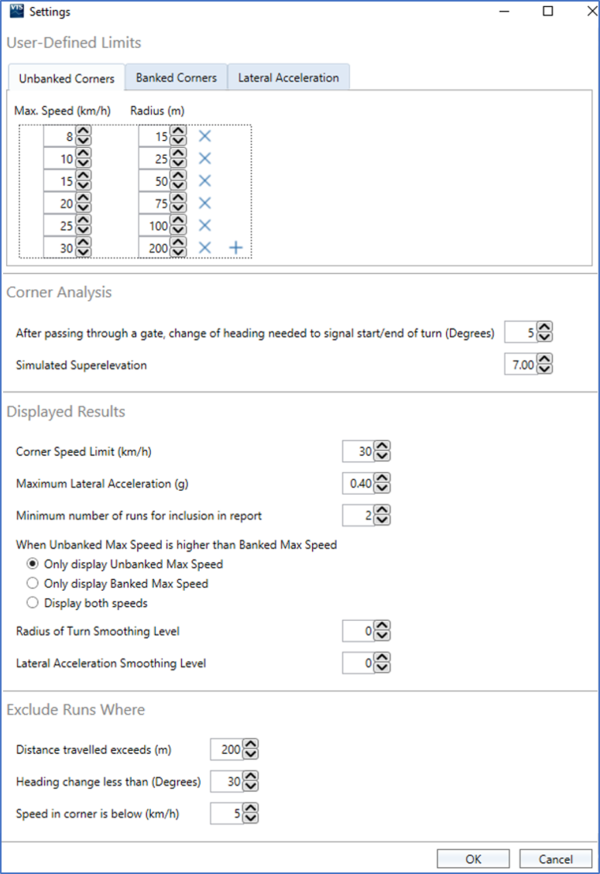
User-Defined Limits
Unbanked Corners
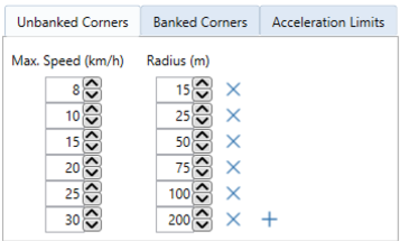
This setting configures the relationship between Maximum Speed Limits, Radius of Turn and Speed for unbanked corners (i.e. corners with 0 % superelevation).
This relationship allows speed limits to be displayed for each run as a results column. This value is based on the measured Speed Radius of Turn for that run. This means that given the Minimum Radius of Turn measured for that run, the maximum speed limit of the vehicle travelling around an unbanked corner should not exceed n km/h based on this relationship.
This relationship also forms results for Unbanked Speed Limit under each corner’s Recommendations section of the Report.
Rows are available to add Maximum Speed limits and the corresponding Radius of Turn values. Interpolation will be used for any values in between those listed. Default values and layout reflects the Michelin Earthmover Use and Maintenance Guide.
Banked Corners
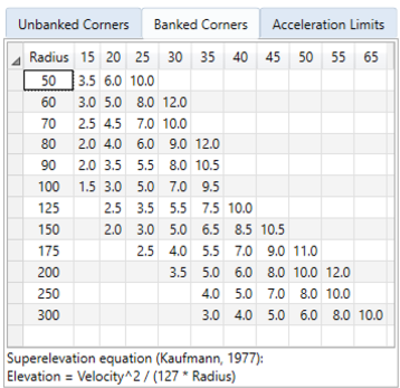
This setting configures the relationship between Superelevation (aka Road / Bank Angle), Radius of Turn and Speed for banked corners (i.e. corners with n % superelevation).
This relationship allows Calculated Superelevation to be determined as a Results column. This value is based on the measured Speed and Minimum Radius of Turn for that run. This means that given the actual speed and Minimum Radius of Turn measured for that run, the required Superelevation would be n % based on this relationship.
This relationship also allows Maximum Speed limits to be determined for a given Simulated Superelevation as a Results column. This value is based on the measured Minimum Radius of Turn and entered Simulated Superelevation value. This means that given the Simulated Superelevation value and the measured Mininum Radius of Turn, the maximum speed of the vehicle should not exceed n km/h based on this relationship.
This relationship also forms results for Banked Speed Limit at n % under each Recommendations section of the Report.
Default equation reflects the Design of Surface Mine Haulage Roads (Kaufman and Ault, US Dept. of the Interior, Bureau of Mines, 1977).
Lateral Acceleration
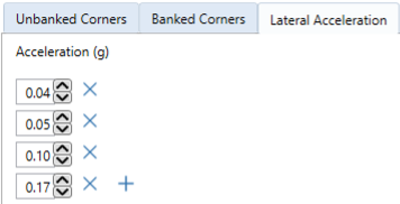
This setting configures limits for Lateral Acceleration during the turn.
This limit allows duration of Lateral Acceleration over a particular value to be represented as a Results column. AccelLimit n is the number of seconds sustained over the Lateral Acceleration of n G whilst the vehicle was turning.
Rows are available to add Lateral Acceleration limits. Each additional row will add a AccelLimit Results column for that value.
Corner Analysis
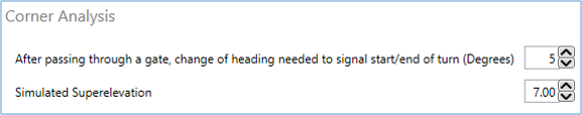
After passing through a gate, change of heading needed to signal start/end of turn (Degrees)

This setting configures the change of heading required for a vehicle to be considering turning after having passed through a valid gate. This setting defines the “only whilst turning” status, so if the vehicle turns more than n degrees after passing through the first gate, the vehicle will be considered as being inside a turn.
This affects the Results columns below, which are results determined for the vehicle “only whilst turning” during a valid run:
- Start Time
- Start Speed
- Min Speed
- Avg Speed
- Max Speed
- Apex Speed
- End Time
- End Speed
- Min Rad of Turn
- Avg Rad of Turn
- Max Rad of Turn
- Max Lat Acc
- Avg Lat Acc
- Max Decel
- Max Accel
Samples are evaluated between entry gate and exit gate. Heading is inspected moving forward in time from entry gate and backward in time from exit gate. Moving forward in time from the point at which the entry gate was passed, the corner is considered to have begun when a sample’s heading differs from the heading at point of passing entry gate by n or more degrees. Moving backward in time from the point at which the exit gate was crossed, the corner is considered to have ended when a sample’s heading differs from the heading at point of crossing exit gate by n or more degrees.
These samples and those in between constitute the vehicle in the corner “only whilst turning”. A higher value will be less sensitive to changes in heading to detect a corner and a lower value will be more sensitive to changes in heading to detect a corner.
Simulated Superelevation

This setting configures a value of Simulated Superelevation to be applied to all corners so a Maximum Speed Limit can be generated for that given value of Simulated Superelevation. If the entered value of superelevation (aka camber, road/bank angle) was implemented, the maximum speed limit – as per the user-defined Banked Corners relationship – will be listed for each turn.
This will form the title of the Banked Max Speed Results column (i.e. Max Speed @ n %). This compares the Minimum Radius of Turn to the Simulated Superelevation to create a theoretical Maximum Speed Limit if n % superelevation was implemented on that corner.
Without necessarily knowing the exact superelevation value for a given corner, this allows the user to simulate maximum allowable speed limits for a given corner if that level of superelevation was hypothetically implemented. Comparing this banked speed limit to actual speed is useful to either change the haul road environment (i.e. superelevation) or operator driving style (i.e. corner speed limit).
Displayed Results
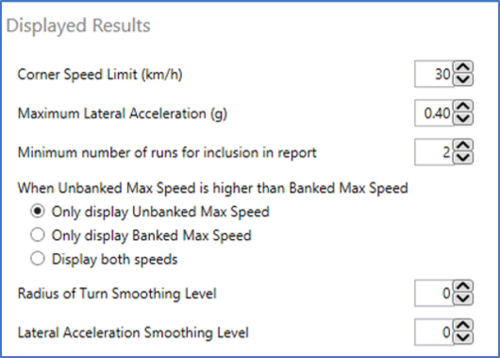
Corner Speed Limit
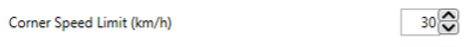
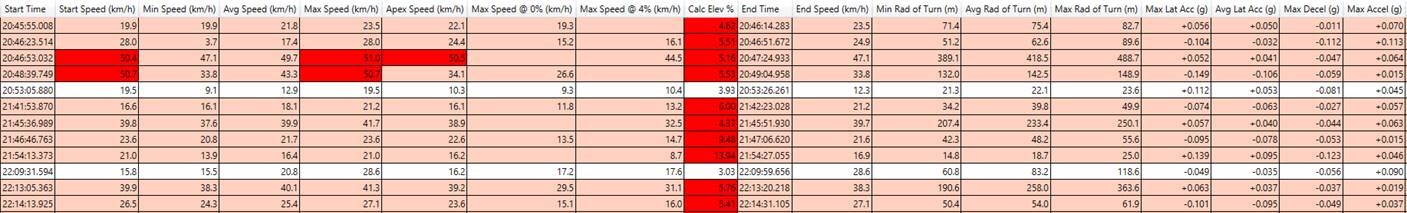
This setting configures a value of Maximum Speed to be applied to all corners to be easily highlighted in the Results.
This highlights the cell red if it exceeds the value entered for any of the Results columns below:
- Start Speed
- Min Speed
- Avg Speed
- Max Speed
- Apex Speed
- End Speed
This allows easy visualisation of runs during which a given Speed Limit was exceeded whilst the vehicle was turning.
Maximum Lateral Acceleration

This setting configures a value of Maximum Lateral Acceleration to be applied to all corners to be easily highlighted in the Results.
This highlights any Max Lat Acc value in the Results red if it exceeds the value entered.
This allows easy visualisation of runs during which a given value of Lateral Acceleration was exceeded whilst the vehicle was turning.
Minimum number of runs for inclusion in Report
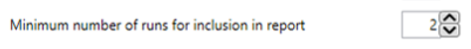
This setting configures the minimum number of valid runs for any given corner to be included in the Report.
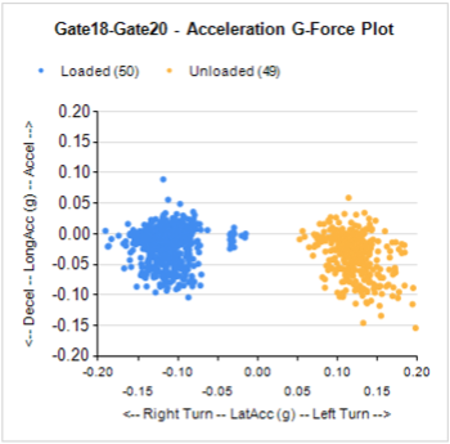
This will affect the number of runs included in the G-plot for a given load status. If the minimum number of runs is less than the number entered for a single load status, the scatter plot of that load status will not be presented. For example, if the minimum number of runs is set as 20 and there are 18 loaded runs and 24 unloaded runs for a particular corner, only the unloaded data will be shown in the scatter plot.
If the minimum number of runs is less than the number entered for both load statuses, the Corner Summary will not be generated for that corner.
This allows the Report to be filtered to only display results for corners with statistically significant results, which improves the relevance of the resultant G-plot.
When Unbanked Max Speed is higher than Banked Max Speed
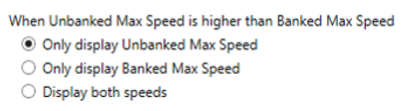
This setting provides display options for Unbanked and Banked Speed Limits in the case that the Unbanked Max Speed Limit is higher than the Banked Max Speed Limit.
This involves two Results columns:
- Max Speed @ 0 %
- Max Speed at n %
There are choices to either display the 1) Unbanked Speed Limit only, or 2) the Banked Speed limit only, or 3) to display both speed limits. This is not a global rule, and the displayed cell can change on a run-by-run basis.
The industry standard for Unbanked Speed limits follow a different type of relationship to the default equation for Superelevation. The industry standard for Unbanked Speed Limits is actually similar to an equivalent Banked Speed Limit for Simulated Superelervation value of 3-4 %. Therefore, with low enough Simulated Superelevation values (e.g. 2 %), it is possible to automatically generate Maximum Speed Limits on Banked corners that are less than the Maximum Speed Limits on Unbanked corners.
This would effectively describe that a vehicle can go faster on an unbanked corner than if slight camber was applied to the corner, which is counterintuitive. To avoid confusion, this setting allows users to choose which speed limit to display in the case that an Unbanked Max Speed Limit is greater than a Banked Max Speed Limit listed against the same run.
Radius of Turn Smoothing Level

This setting configures the smoothing level applied to the Radius of Turn within the Results.
Lateral Acceleration Smoothing Level

This setting configures the smoothing level applied to the Lateral Acceleration within the Results.
Exclude Runs Where
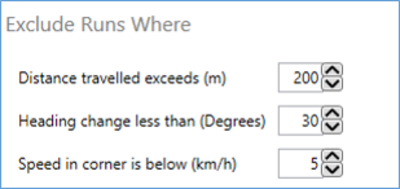
Distance travelled exceeds
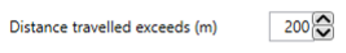
This setting configures a maximum limit for distance travelled after passing through a gate to maintain being in a valid run.
This limit allows the user to exclude runs where the vehicle has passed through a gate that is intended to be the end gate following a corner. Without this setting, the test might not reset and unintended corner results could be generated between end gates and any gates that would follow. Therefore, it is important that gates on the Map are positioned in pairs around the corner of interest with maximum distance apart to be within this entered distance.
If the distance exceeds the entered value after passing through a gate, the test conditions will reset and the software will wait for two gates to be passed within the entered distance to detect the next valid run.
Heading change less than

This setting configures a minimum change in heading between two gates to maintain being in a valid run.
This limit allows the user to exclude runs where the vehicle may not complete a turn, and might travel straight following a start gate, resulting in the required change of heading to not take place before the end gate is passed. Therefore, it is important that this entered value is less than the difference between the start gate heading and end gate heading for corners with slight changes in heading (e.g. high speed corners).
If the difference in heading between the start gate and end gate is less than the entered value, the test conditions will reset and the software will wait for two gates to be passed with sufficient differences in heading to detect the next valid run.
Speed in corner is below
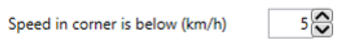
This setting configures a minimum limit for speed after passing through a gate to maintain being in a valid run.
This limit allows the user to exclude results where the vehicle may slow down during a turn, and might stop in an intersection, resulting in the run not being in a continuous corner and therefore not comparable to other runs.
If the speed drops below the entered value after passing through a gate, the test conditions will reset and the software will wait for two gates to be passed whilst maintaining speed above the entered value to detect the next valid run.
Session Data
By pressing the 'Edit Data' button in the ‘Test Setup' ribbon bar, a new window will be displayed whereby the user can enter vehicle information to be stored against the .vbo file. There is functionality to Import and Export Session Data to load the same information to other .vbo files, such a vehicle, temperature and tyre information.
Vehicle
This section of Session Data allows you to enter vehicle information to be stored against the .vbo file, which will help to identify the vehicle when generating reports.
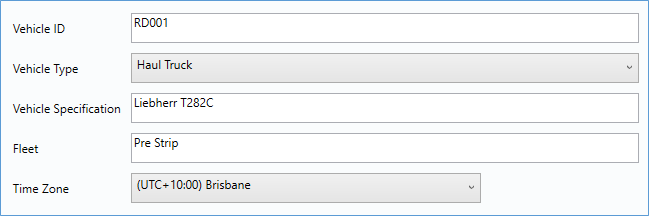
Below is the layout of the Report header:
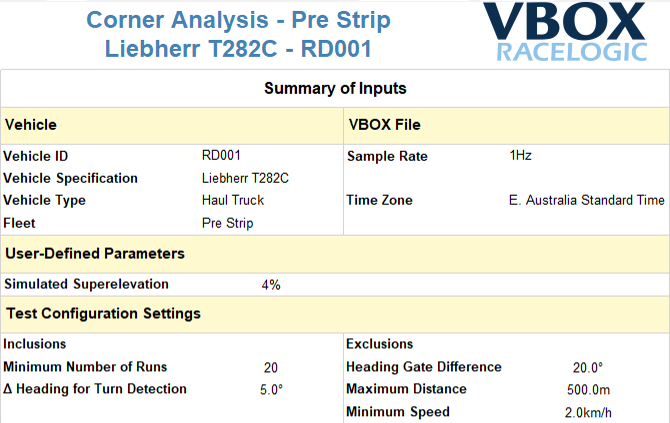
- Vehicle ID - This is a descriptive text field which will be displayed as part of the heading on the Report.
- Vehicle Type - Defines the TKPH calculation based on vehicle type, and is mostly commonly set as Haul Truck.
- Vehicle Specification - This is a descriptive text field, which will be displayed as part of the heading on the Report.
- Fleet - This is a descriptive text field, which will be displayed as part of the heading on the Report.
- Time Zone - Here you can select the time zone of the region in which the data was gathered, so the Report and Results can display local time.
Chart
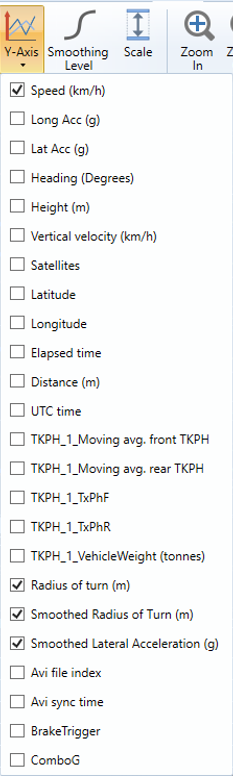
Y-Axis
In 'Chart', you will see several mining-specific parameters when you click on Y-Axis. The following parameters have been introduced to the Corner Analysis plugin:
- Smoothed Radius of Turn
- Smoothed Lateral Acceleration
Map
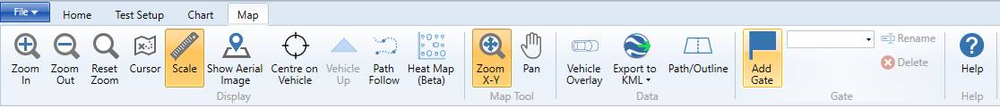
Corner Gates
On the Map, you can set Gates by clicking anywhere on a route and clicking Add Gate. This will draw a Gate perpendicular to the direction of travel, with a globally fixed width. Gate width refers to the total length of the line as shown on the Map. Gate width can be changed and this value will be applied to all Gates on the Map. Individual Gates can be renamed to distinguish the area, and this name will be used in the Results and Report when identifying the corner of interest.
Placement of Gates is important since it allows the software to identify corners and generate results given appropriate Test Configuration settings. It is therefore important that the user places Gates carefully before and after each corner of interest to capture all valid runs. When a valid run is captured between two gates, the first Gate is considered the Start Gate and the second Gate is considered the End Gate. This terminology is referred to in the run exclusion settings in Test Configuration.
The corner is not simply the area between the Start Gate and End Gate. The Start Gate and End Gate helps the software identify corners. After the vehicle passes through the Start Gate, it will wait until the required change of heading is satisfied to signal the start/end of the turn.
When placing Gates, it is important to capture the path of a single corner to produce effective results. For example, avoid placing Gates around corners where two turns have taken place.
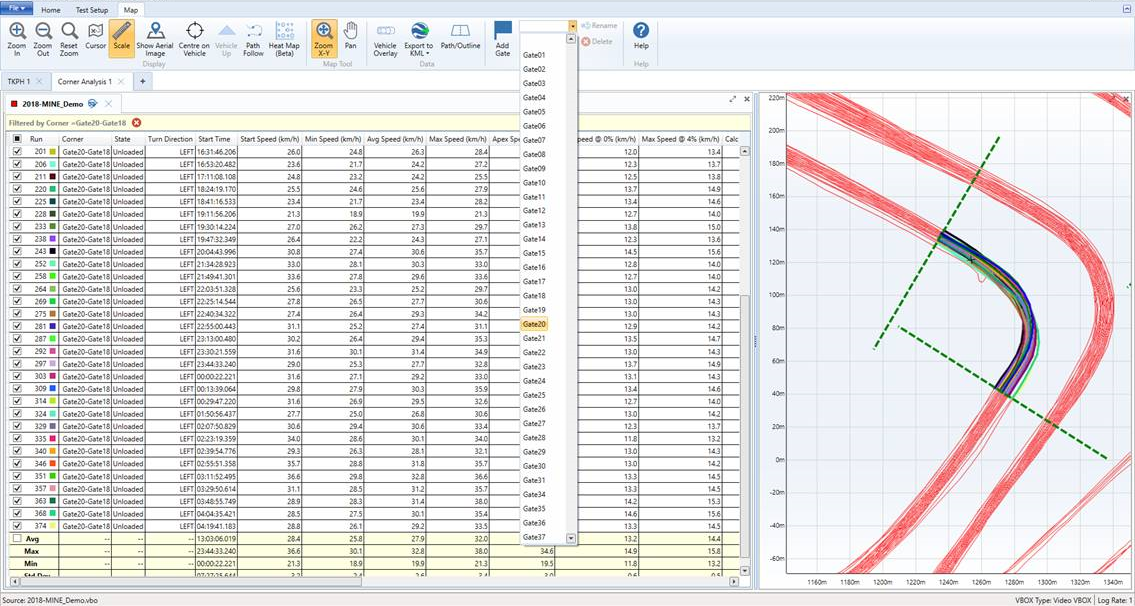
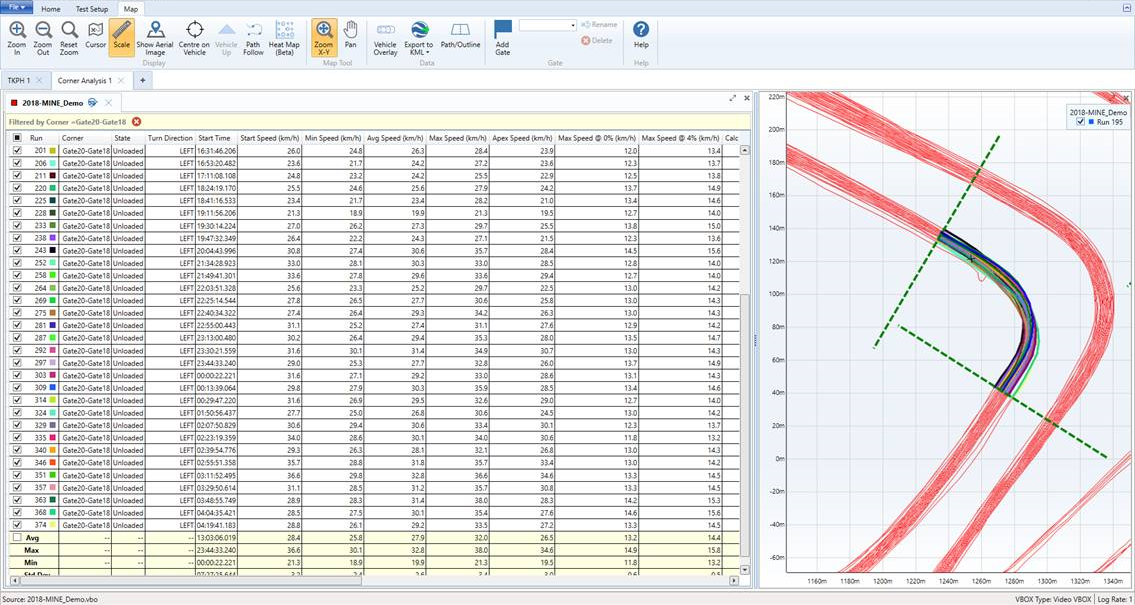
Manual Run Selection
It is possible to manually select a particular group of Runs for analysis in the Report. If no runs are checked, all valid runs are automatically detected and filtered based on Test Configuration settings entered by the user.
If any runs are manually selected in the Results section, only the selected runs will be available in the Report analysis. To manually select Runs, Results can be filtered and deselected either from the check boxes in the Results section or on the Map by clicking on the highlighted run and unchecking it from the pop up box on the Map.
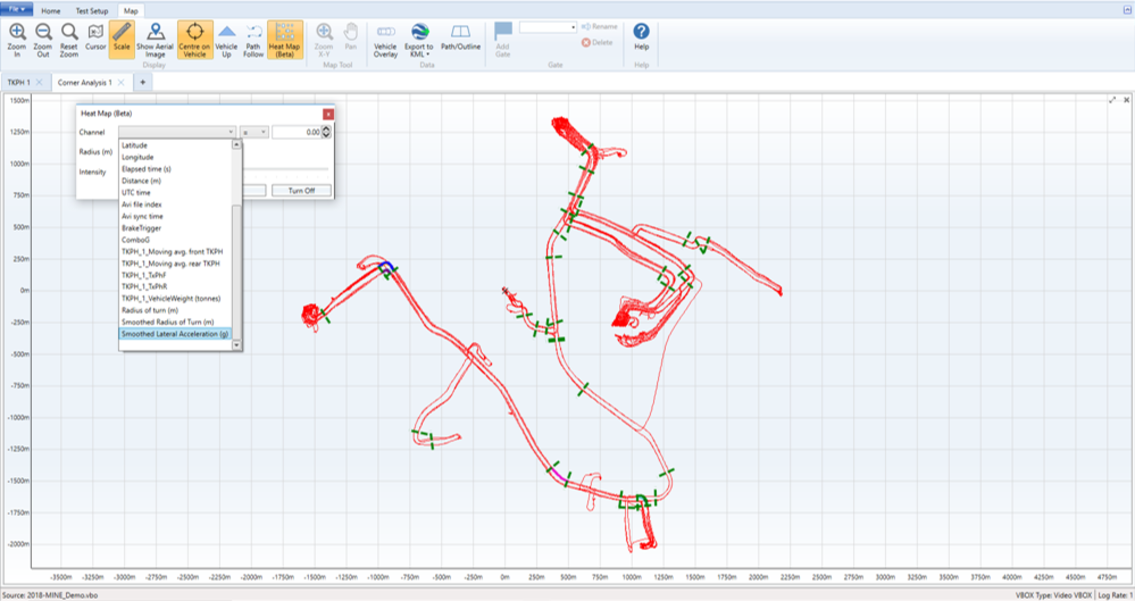
Heat Map
A Heat Map allows users to add colour to areas of the Map according to Channel conditions. In a way, it is a graphical representation of Pass Conditions, as samples that meet certain conditions will be highlighted on the Map.
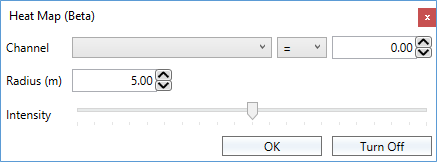
Channels can be selected from the dropdown menu, which also includes Channels created from additional Maths Channels or previously loaded plugins.
Once a Channel is selected, a condition can be selected to filter the samples that will be analysed for display.
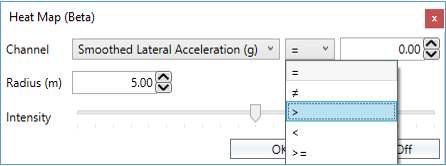
A value can then be assigned to be related to the chosen Channel.
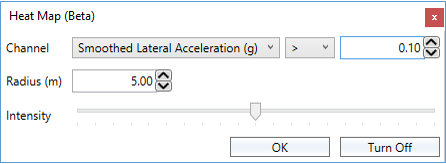
The Radius of the displayed area can be adjusted to suit the desired view. For example, when using the Heat Map for Corner Analysis it is recommended to choose a value less than half of the minimum distance between routes in opposite directions.
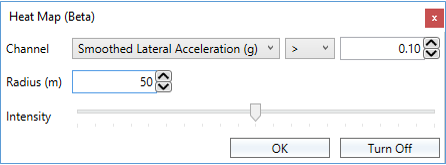
The Intensity slider adjusts the range of colour displayed.
- A high slider value will create high Intensity and a high range of colour when representing a high number of values meeting the defined conditions. This will display high frequency areas with more red colour.
- A low slider value will create low Intensity and a lower range of colour when representing a high number of values meeting the defined conditions. This will display high frequency areas with less red colour.

Results
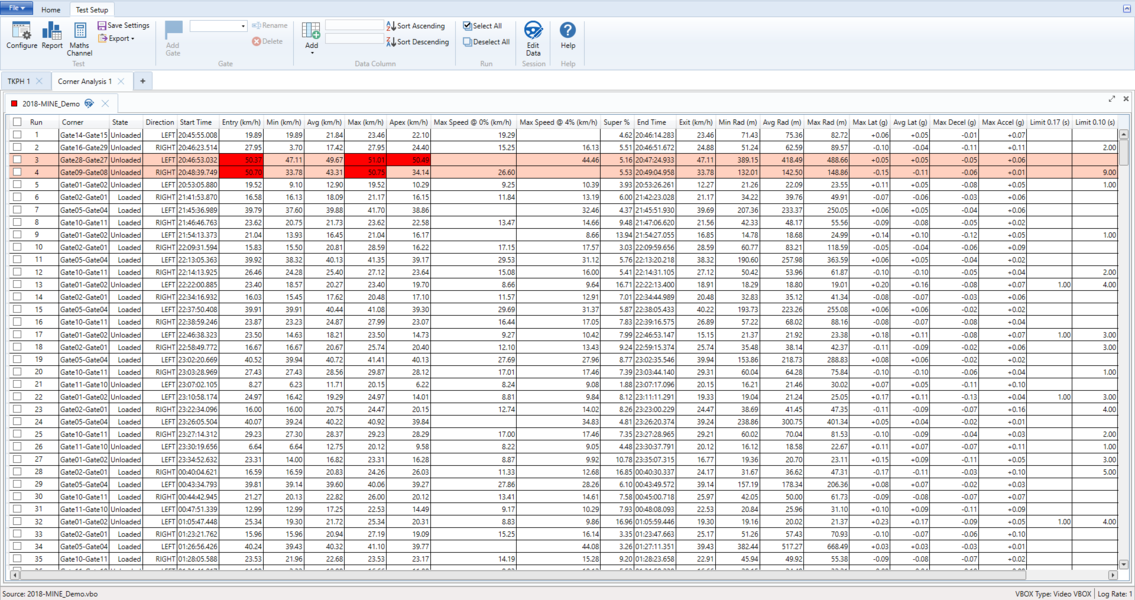
- Run - Assigns a number to the row as per the Results section. In the case of this plugin, a run represents a turn being completed between two gates whilst satisfying all other test conditions. A ‘turn’ is defined as the part of the run between the Start Gate and the Exit Gate where the heading deviates from Start/Exit heading by n degrees, as entered in Test Configuration.
- Corner - Shows the Start Gate and End Gate as the vehicle passes through it. For example, if a valid run occurs as a result of a vehicle passing through GateA followed by GateB, the corner will be listed as GateA-GateB.
- State - Refers to the load state of the vehicle during the run (i.e. loaded/unloaded) as determined by the TKPH plugin when carried out before corner analysis. The TKPH test needs to be carried out in a tab to the left of the Corner Analysis tab for the load state to carry over from the preceding test.
- Direction - Refers to the turn direction by comparing the difference between heading at the start of the turn and the heading at the end of the turn.
- Start Time - Refers to local time at the start of the run, when the vehicle passes through the Start Gate.
- Entry - Refers to speed at the start of the turn. It is not recorded as the speed at which the vehicle passes through the Start Gate.
- Min - refers to minimum speed during the turn.
- Avg - Refers to average speed during the turn.
- Max - Refers to maximum speed during the turn.
- Apex - Refers to speed during the tightest point of the turn where the Radius of Turn is at its minimum value. It is not calculated based on the native Radius of Turn channel.
- Max Speed @ 0% - Refers to the speed limit as generated by the relationship in Test Configuration settings to represent Unbanked Speed Limits. This value is based on the Minimum Radius of Turn and the Unbanked Speed Limit relationship. The relationship default is sourced from the Use and Maintenance Guide, Michelin Earthmover.
- Max Speed @ n% - Refers to the speed limit as generated by the relationship in Test Configuration settings to represent Banked Speed Limits. This value is based on the Minimum Radius of Turn, Simulated Superelevation and the Banked Speed Limit relationship. The relationship default is sourced from the Design of Surface Mine Haulage Roads (Kaufman and Ault, US Dept. of the Interior, Bureau of Mines, 1977).
- Super % - This is the Required Superelevation (aka Road / Bank Angle) given the way in which the vehicle was travelling around the corner and the Banked Speed Limit relationship. This value is based on the Minimum Geometric Radius of Turn, Apex Speed and the Banked Speed Limit relationship. It is not calculated based on the native Radius of Turn channel. The relationship default is sourced from the Design of Surface Mine Haulage Roads (Kaufman and Ault, US Dept. of the Interior, Bureau of Mines, 1977).
- End Time - Refers to local time at the end of the run, when the vehicle passes through the End Gate.
- Exit - Refers to speed at the end of the turn. It is not recorded as the speed at which the vehicle passes through the End Gate.
- Min Rad - Refers to the minimum value of the Radius of Turn as calculated during the turn.
- Avg Rad - Refers to the average of all Radius of Turn values calculated during the turn.
- Max Rad - Refers to the maximum value of the Radius of Turn as calculated during the turn.
- Avg Lat - Refers to the average Lateral Acceleration during the turn.
- Max Lat - Refers to the maximum Lateral Acceleration during the turn.
- Max Decel - Refers to the maximum Longitudinal Acceleration in the negative direction during the turn. This value is based on the standard Longitudinal Acceleration channel.
- Max Accel - Refers to the maximum Longitudinal Acceleration in the positive direction during the turn. This value is based on the standard Longitudinal Acceleration channel.
- Limit - Refers to the time in seconds spent above the predefined limit of n g. More Results columns will be populated depending on the number of Lateral Acceleration limits entered by the user.
Creating a Report
VBOX Test Suite allows the user to create a report whereby the user can easily compare and display the results from their Corner Analysis.
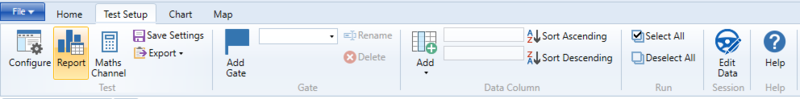
You are able to generate a report by clicking the 'Report' button under the 'Test Setup' ribbon bar.
The user can then choose to print or save this report in Microsoft Word, Microsoft Excel or pdf formats. Information on this report can be seen below:-
Summary of Inputs
This Report Table summarises user input to help verify information used for the analysis.
Corner Analysis
Following the Summary of Inputs, each individual corner will have a page summarising key results. User inputs for Report features can be found in Test Configuration.
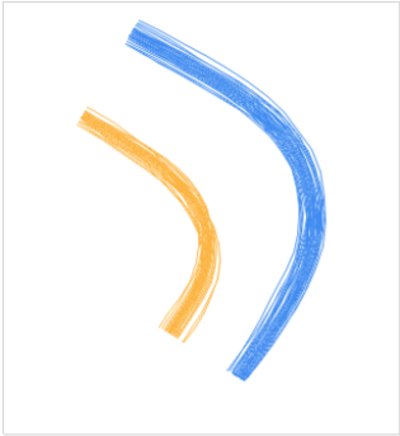
Corner Map
This map shows the valid runs that have been taken into consideration for the analysis. The routes are colour coded based on load status when the TKPH plugin has been conducted in a tab to the left of the Corner Analysis test.
Acceleration G-Force Plot
This plots the acceleration values calculated for the corner only while the vehicle is considered to be in a turn. Each dot represents one sample having the corresponding value of acceleration. Bounds are fixed at ±0.2 g.
Corner Results Summary
This Report Table summarises user input to help verify information used for the analysis.
When a TKPH Analysis is conducted in a tab to the left of the Corner Analysis tab, this allows the software to know if the vehicle is loaded or unloaded at any one point in time.
With this information, the plugin will generate a set of summarised results each for the loaded runs and for the unloaded runs.
- Number of Runs - This value is the number of valid runs for the corner of interest as listed in the Results section, which is determined by Test Configuration settings.
- Turn Direction - This describes if the turn direction is either left or right, and is based on the Start Gate heading and the End Gate heading of the corner for each run whilst the majority.
For the parameters of interest, results across all valid runs are summarised with the following categories:
- Min - This value is the absolute minimum value of the parameter of interest.
- Avg - This value is the average of all values relating to the parameter of interest.
- Max - This value is the absolute maximum value of the parameter of interest
- CV - This value is the Coefficient of Variation (also known as relative standard deviation RSD), which is the standard deviation as a proportion of the mean. This is represented as a percentage and can be used to correlate the degree of variation within a dataset. It is calculated as σ / μ (%).
Radius of Turn (RoT)
- Min. RoT (during turn)
- This value refers to the minimum value of the Radius of Turn as calculated during the turn.
Lateral Acceleration
- Corner g
- This value refers to the average Lateral Acceleration during the turn.
- Peak g
- This value refers to the maximum Lateral Acceleration during the turn.
Speed
- Start of Turn
- This value refers to speed at the start of the turn, where the turn is detected by the software and user-defined Test Configuration settings. It is not the speed at which the vehicle passes through the Start Gate.
- At Min. RoT
- This value refers to speed during the tightest point of the turn where the Radius of Turn is at its minimum value.
- At Peak g
- This value refers to speed during the the turn where the Lateral Acceleration is at its maximum value.
- End of turn
- This value refers to speed at the end of the turn, where the turn is detected by the software and user-defined Test Configuration settings. It is not the speed at which the vehicle passes through the End Gate.
Recommendations
Note. Racelogic does not provide Recommendations through its software – these Recommendations are User-Defined Recommendations made available for the user with Test Configuration options. It is the responsibility of the user to build the Test Configuration to display the Recommendation section as needed and interpret the results appropriately.
- Unbanked Speed Limit
- This value refers to the speed limit as generated by the relationship in Test Configuration settings to represent Unbanked Speed Limits. This value is based on the Minimum Radius of Turn and the Unbanked Speed Limit relationship. The relationship default is sourced from the Use and Maintenance Guide, Michelin Earthmover.
- Banked Speed Limit at 4% Simulated Superelevation
- This value refers to the speed limit as generated by the relationship in Test Configuration settings to represent Banked Speed Limits. This value is based on the Minimum Radius of Turn, Simulated Superelevation and the Banked Speed Limit relationship. It is not calculated based on the native Radius of Turn channel. The relationship default is sourced from the Design of Surface Mine Haulage Roads (Kaufman and Ault, US Dept. of the Interior, Bureau of Mines, 1977).
- Required Superelevation
- This value is the Required Superelevation (aka Road / Bank Angle) given the way in which the vehicle was travelling around the corner and the Banked Speed Limit relationship. This value is based on the Minimum Radius of Turn, Speed and the Banked Speed Limit relationship. The relationship default is sourced from the Design of Surface Mine Haulage Roads (Kaufman and Ault, US Dept. of the Interior, Bureau of Mines, 1977).