05 - VBOX Broadcast Setup Creating a single bar graph
A single bar graph is a rectangular gauge with an expanding bar which can be used to display any data available from GPS or CAN, such as Lateral Acceleration (GPS), Engine Temp (CAN) etc.

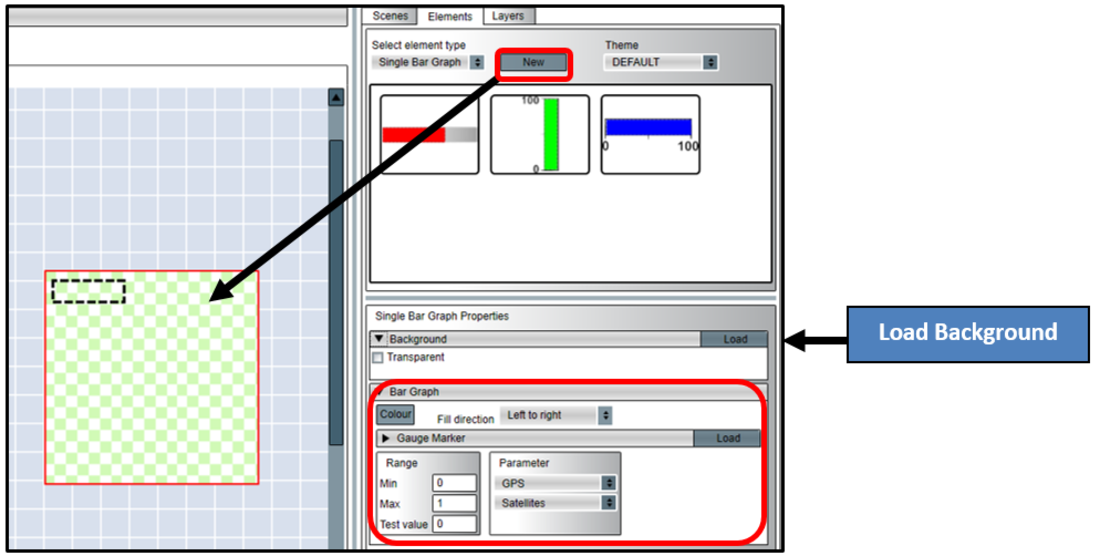
To create a single bar graph, use the Elements tab -> Single bar graph -> New
Click on the load button to choose a background image, or tick the box to set this to transparent.
The fill direction, colour, range and marker (moving pointer), can all be changed within the highlighted properties section.
To change the position, height and width of the fill section, simply click and drag the bottom right corner of the coloured bar.
.png?revision=1)
There are some bar graphs which have already been set up. To load any of these, simply drag and drop into the main view window, assign a parameter and set the range.
.png?revision=1)
