06 - VBOX Broadcast Setup Creating an XY (G-force style) element
Using double bar graph
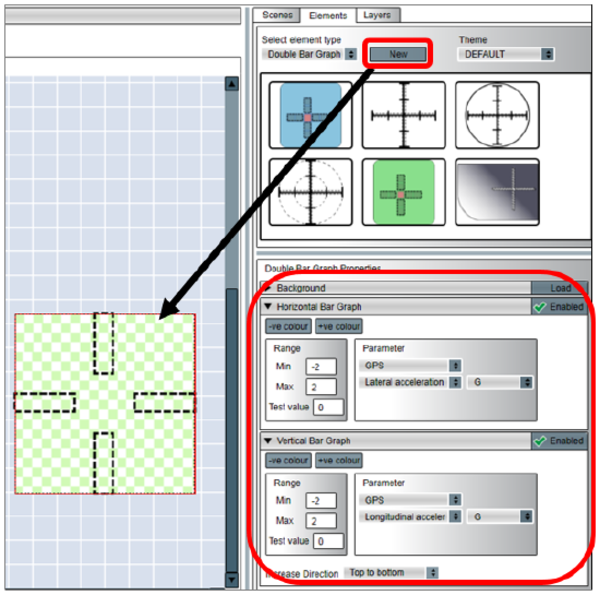
A Double Bar Graph is created in a similar way to the single bar graph.
.png?revision=1)
The default parameters for this element are Lateral acceleration on the X axis and Longitudinal acceleration on the Y axis.
The fill direction, individual axis colours, associated parameters and ranges are all adjustable using the double bar graph properties tab (highlighted).
To change the position, height and width of the fill, simply click and drag the bottom right corners of the dotted bars.
There are some double bar graphs which have already been set up. To load any of these, simply drag and drop into the main view window, assign parameters and set ranges.
.png?revision=1)
Using a circular XY Plot
A circular XY gauge can be used to show G-force as a moving dot. It is created in the same way as the double bar graph but using Elements tab - XY Plot – New.
To load a pre-configured XY plot, simply drag and drop from the thumbnail into the main view window.
.png?revision=1)
The displayed parameters, ranges and dot type are all adjustable using the XY Plot properties tab.
