UNR79 Max Lat. Acc.
Introduction
The ‘UNR79 Max Lat. Acc.’ test is a plugin for the VBOX Test Suite software.
The test allows the user to complete and analyse a Maximum Lateral Acceleration test as described in the UNR79 document.
Ribbon Bar
The UNR79 Max Lat. Acc. test has a unique 'Test Setup' ribbon bar, from which the test and test area can be configured.
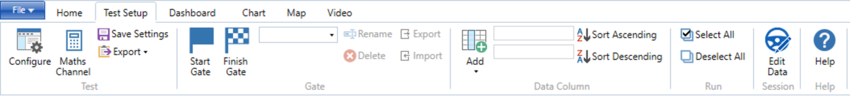
Note: Ribbon bar icons may move/ resize dependent on the Software window size.
Test
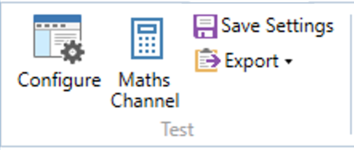
Configure
The 'Configure' button displays a pop up window whereby the parameters of the test can be defined.
Gate
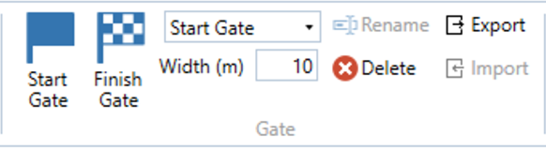
Start Gate
Pressing the ‘Start Gate’ button will add a virtual gate to the chart and map area at the point of the cursor which acts as the start of the test, indicated by a green coloured line. The currently selected gate is indicated by a dark blue coloured line. Once a gate has been added, the gate width can be specified (10 m by default).
IMPORTANT - When adding a gate, the vehicle must be travelling greater than 0.8 km/h in order to ascertain the heading of the gate.
Finish Gate
Pressing the ‘Finish Gate’ button will add a virtual gate to the chart and map area at the point of the cursor which acts as the end of the test, indicated by a red coloured line. The currently selected gate is indicated by a dark blue coloured line. Once a gate has been added, the gate width can be specified (10 m by default).
IMPORTANT - When adding a gate, the vehicle must be travelling greater than 0.8 km/h in order to ascertain the heading of the gate.
Data Column

Add
The 'Add' button adds a column to the test results area. Selecting this button will bring up a drop down window where the user can select a channel to display in the test results window.
Sort Ascending/Sort Descending
The Sort Ascending and Sort Descending buttons will sort the values based on the currently selected column in the results area.
Run
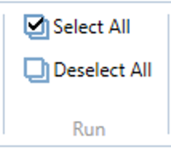
Select All (Ctrl+A)
The 'Select All' button allows the user to tick every run in the results area at once. This can also be accessed by using the keyboard shortcut 'Ctrl+A'.
Deselect All (Ctrl+E)
The 'Deselect All' button allows the user to de select every run in the results area at once. This can also be accessed by using the keyboard shortcut 'Ctrl+E'.
Edit Data
The 'Edit Data' button allows the user to enter session specific data such as tyre specification.
Help (F1)

Pressing this 'Help' button will automatically open an internet browsing window and load the relevant section of the Racelogic Support Centre. This page will only be displayed if there is a valid internet connection. If there is no valid internet connection, a cached version of the relevant section (from the last software update) will be presented in PDF form. This can also be accessed by using the keyboard shortcut 'F1'.
Test Configuration
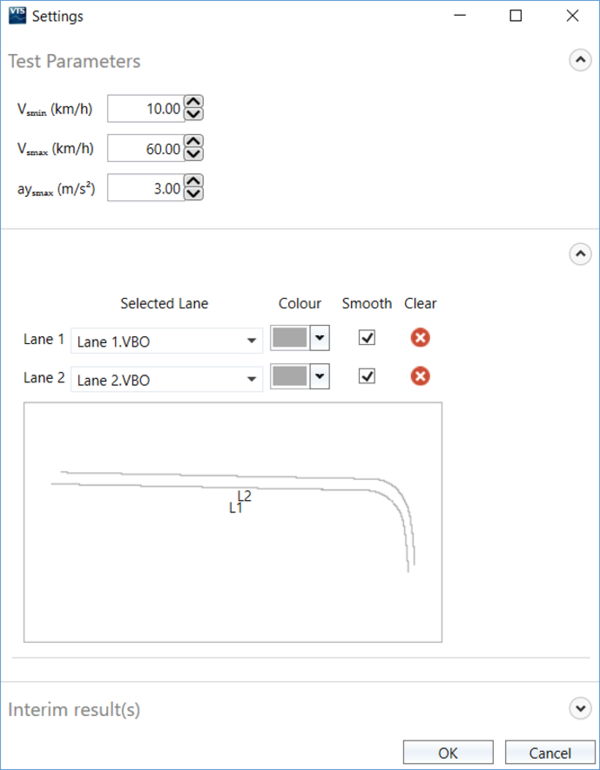
Selecting the 'Configure' button will display a pop up window where the user can define the parameters of the test. These include the lane information as well as the pass conditions.
If a pass condition is not met, the Result Column will be highlighted deep red and the whole run will be highlighted light red.
Use the up and down buttons  to the right of the parameters to Expand and Collapse the parameter headings.
VsminThis parameter denotes the minimum vehicle speed used as the pass condition for the test. VsmaxThis parameter denotes the maximum vehicle speed used as the pass condition for the test. aysmaxThis parameter denotes the maximum lateral acceleration used as the pass condition for the test. |
 |
Lanes
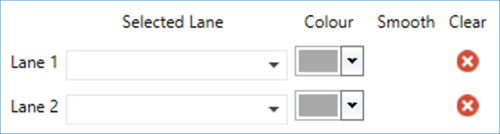
The lanes used within the test can be either loaded from a saved file or surveyed live within the software when in 'Online' mode. Once lanes have been configured, you can use the window at the bottom to visualise (check) the lanes, designated as L1 and L2. You are also able to change the associated colours and apply smoothing.
Note: If only 1 lane is available, the software will still calculate lane range values.
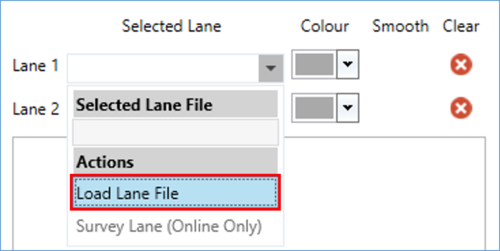
Load Lanes
To load the lanes from saved .vbo (VBOX), .vbc (lane departure) or previously surveyed files, select the dropdown menu next to a lane and click on 'Load Lane File'. Navigate to the saved file and select 'Open' to load in to the software. Repeat for the other lane.
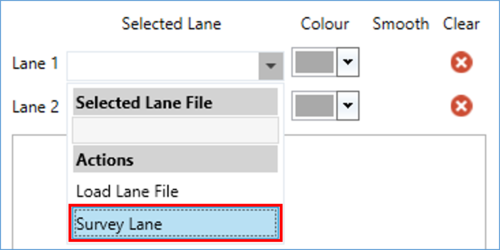
Survey Lanes (Online only)
When VBOX Test Suite is connected to a VBOX in 'Online' mode, the lanes can be surveyed live from within the software. There are two options available; either using a series of 'static' points to create straight lines, or surveying a continuous 'complex' line. Select the dropdown menu next to a lane and click on 'Survey Lane'.
 |
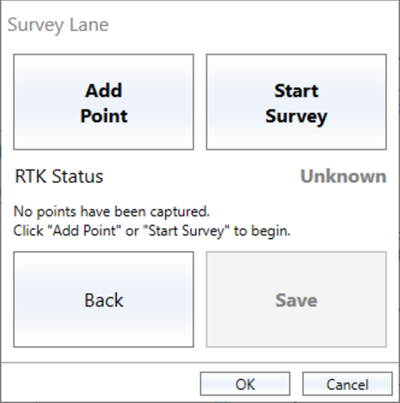 |
Within the Survey Lane window, the current RTK status of the VBOX is shown to give you a clear indication of the DGPS correction status before you begin the survey. For the status to work correctly, the 'Solution Type' channel needs to be chosen to 'Send over serial' within the VBOX Setup Software.
RTK Status messages:
- Fixed
- Float
- Not Fixed
- No Solution
- Unknown
Add Points
If you would like to set a series of points to be used as a lane, for example, on a relatively straight road, ensure the VBOX equipment is set up for Straight Line Surveying and use the 'Add Point' button function. Once all required points have been set (minimum of 2 points required), select 'Save' and choose a suitable location and filename.
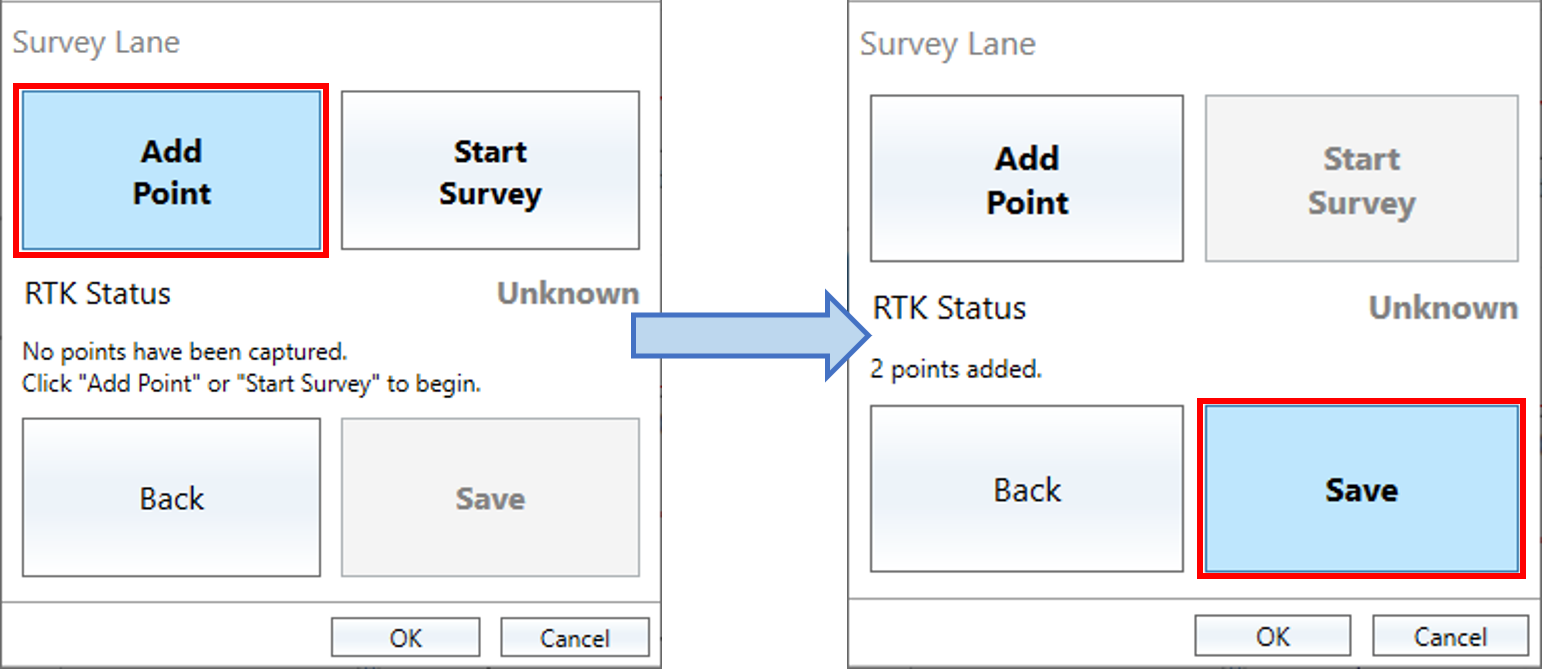
Note: The number of points added is shown within Survey Lane window.
Once saved, the lane will be added to the settings window. The saved lane can also be reused again later by Loading in to the software. Repeat the process for the other lane.
Survey
If you would like to survey a lane, for example, on a curved road, ensure the VBOX equipment is set up for Curved Line Surveying and select the 'Start Survey' button. Once surveyed, click 'Stop Survey'. Select 'Save' and choose a suitable location and filename.
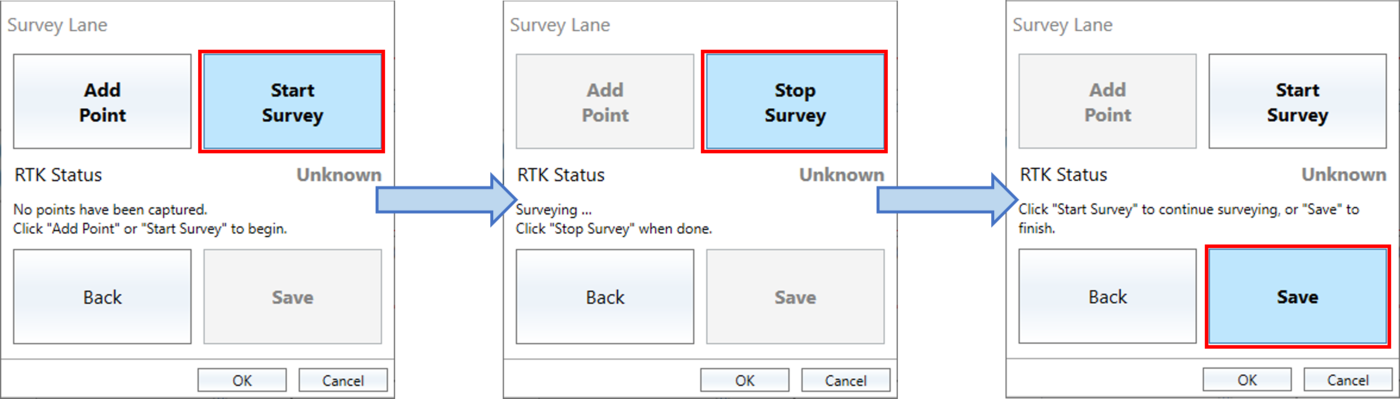
Note: During the survey, the Survey Lane window will display 'Surveying ...'.
Once saved, the lane will be added to the settings window. The saved lane can also be reused again later by Loading in to the software. Repeat the process for the other lane.
Load Lanes
To load the lanes from saved .vbo (VBOX), .vbc (lane departure) or previously surveyed files, select the dropdown menu next to a lane and click on 'Load Lane File'. Navigate to the saved file and select 'Open' to load in to the software. Repeat for the other lane.
Survey Lanes (Online only)
When VBOX Test Suite is connected to a VBOX in 'Online' mode, the lanes can be surveyed live from within the software. There are two options available; either using a series of 'static' points to create straight lines, or surveying a continuous 'complex' line. Select the dropdown menu next to a lane and click on 'Survey Lane'.
|
|
Within the Survey Lane window, the current RTK status of the VBOX is shown to give you a clear indication of the DGPS correction status before you begin the survey. For the status to work correctly, the 'Solution Type' channel needs to be chosen to 'Send over serial' within the VBOX Setup Software.
RTK Status messages:
- Fixed
- Float
- Not Fixed
- No Solution
- Unknown
Add Points
If you would like to set a series of points to be used as a lane, for example, on a relatively straight road, ensure the VBOX equipment is set up for Straight Line Surveying and use the 'Add Point' button function. Once all required points have been set (minimum of 2 points required), select 'Save' and choose a suitable location and filename.
Note: The number of points added is shown within Survey Lane window.
Once saved, the lane will be added to the settings window. The saved lane can also be reused again later by Loading in to the software. Repeat the process for the other lane.
Survey
If you would like to survey a lane, for example, on a curved road, ensure the VBOX equipment is set up for Curved Line Surveying and select the 'Start Survey' button. Once surveyed, click 'Stop Survey'. Select 'Save' and choose a suitable location and filename.
Note: During the survey, the Survey Lane window will display 'Surveying ...'.
Once saved, the lane will be added to the settings window. The saved lane can also be reused again later by Loading in to the software. Repeat the process for the other lane.
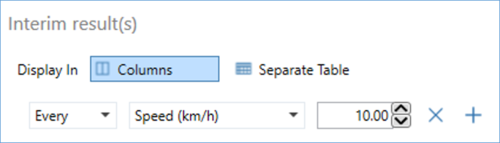
Interim result(s)
|
The software allows the user to display intermediary results called ‘Interim results’. The Interim results are determined by adding in ‘Interim Conditions’. Pressing the '+' button will add a new interim result. It is possible to have this line appear at ‘Every’ instance of the value (e.g. Every 10 km/h), ‘At’ an instance of a value (e.g. Only at 10 km/h) or 'Between' values (e.g. Between 30 km/h and 50 km/h). When 'Columns' is selected, each interim result is shown as a column within the right hand side of the results table, if 'Separate Table' is selected, each interim result is shown as a row in a separate table next to the results table. |
 |
Completing a Test
To start an online test, the user must first select the correct COM port from the ‘Online’ drop down menu in home tab. Once connected to a VBOX, the dashboard will change to show the 'START', 'STOP' and 'RESET' buttons.
Setting Start/Finish Lines
Before the software can begin to produce results, the user must first set the ‘Start Gate’ and ‘Finish Gate’ lines. To do this when connected to a VBOX, the user must drive to the required point on the track and press the relevant button on the ‘Test Setup’ tab. Once pressed, the software will require the user to drive away in a straight line to understand the direction of which the line should be set.
To set the start lines in a previously recorded file, the user must position the map cursor on the correct part of the track and then press the relevant button on the ‘Test Setup’ tab.
No matter whether the user is connected to a VBOX or not, Racelogic recommend that the saving of test settings once the lines have been set. This will allow the user to repeatedly recall these test lines without having to set them individually for each test.
Test Results Area
The test results area is the area that displays all of the results from the current test. Within this area it is possible to include/exclude results from the chart area, display the average/max/min values and also easily identify any runs which have not met the pass criteria.
Every time a new test is started (via the 'START' button on the dashboard), or a new file is loaded, a new tab will be added to the test results area, allowing the user to switch between separate tests or files and compare runs from each. A session can be removed from the results area by pressing the ‘x’ icon on the tab.
Session Data
By pressing the 'Edit Data' button .jpg?revision=4&size=bestfit&width=60&height=57) next to the name of the file/run or in the ‘Test Setup' ribbon bar, a new window will be displayed whereby the user can add various different pieces of vehicle and test information, such as:-
next to the name of the file/run or in the ‘Test Setup' ribbon bar, a new window will be displayed whereby the user can add various different pieces of vehicle and test information, such as:-
Vehicle Overlay
The vehicle overlay section allows the user to configure the required vehicle measurement points and enter antenna placement offsets.
There is no limit to the number of vehicle measurement points that can be set.
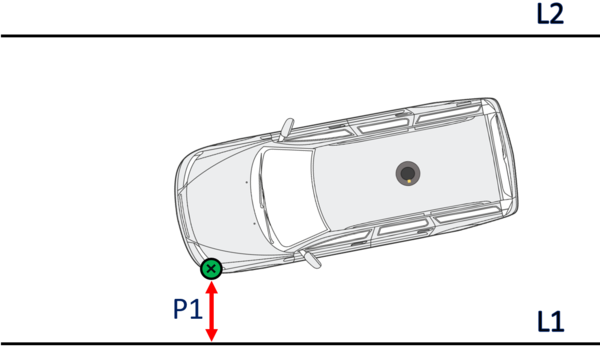
Points should be measured from the primary antenna as shown below.
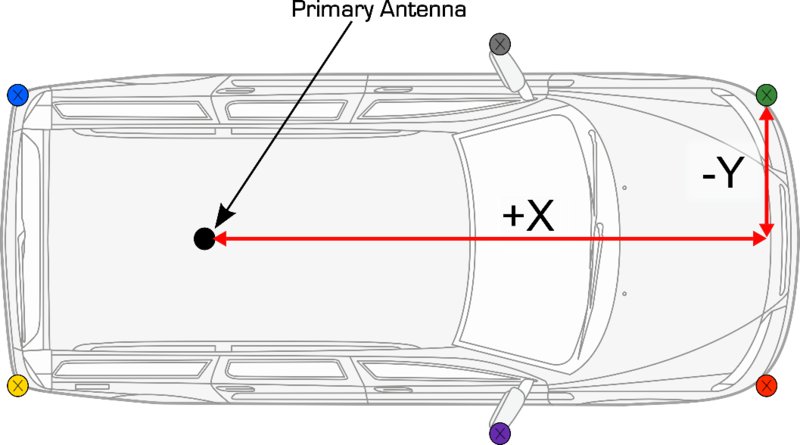
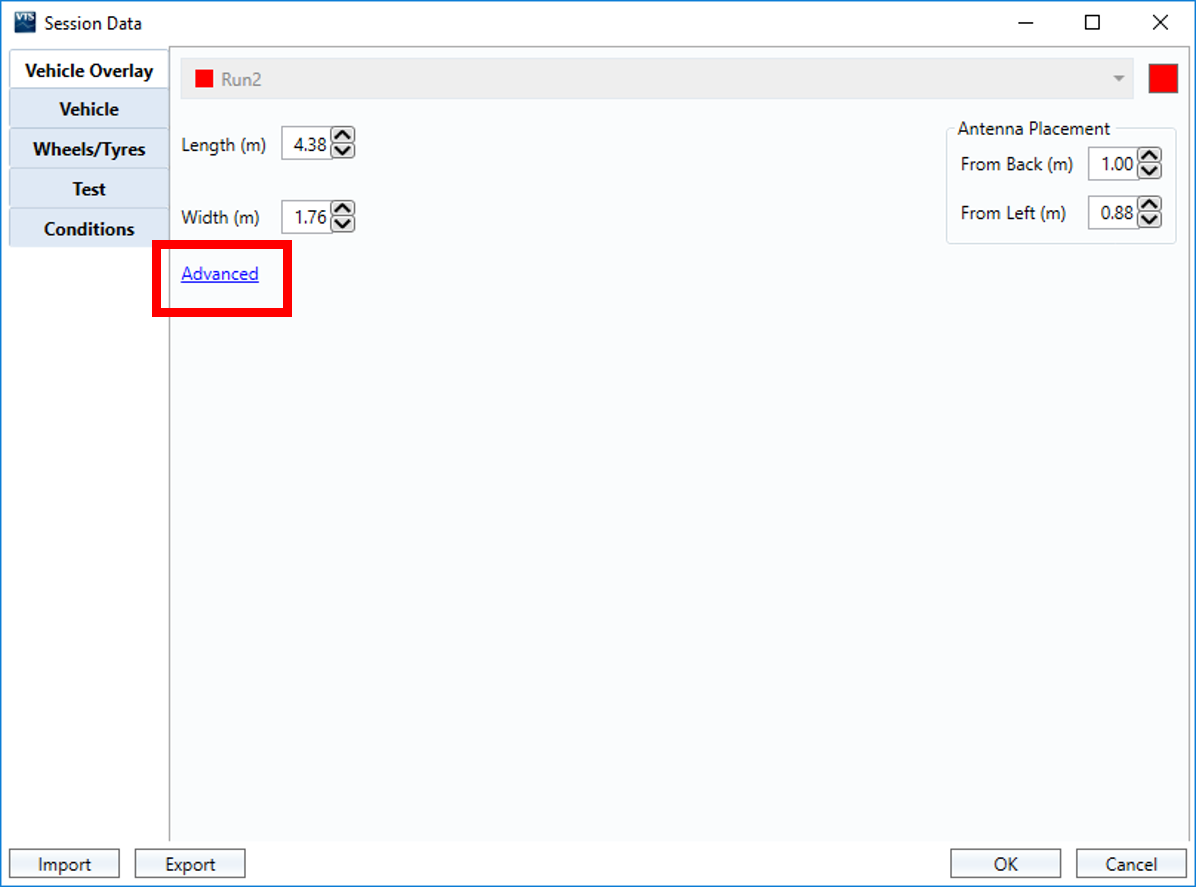
Selecting ‘Advanced’ will expand the window and enable a vehicle point editing functionality, allowing the creation of custom shapes for the vehicle.
Pressing the ‘+’ button will add more points which can be configured by entering antenna offset values. Points can also be manually dragged in to place by selecting and holding the desired point.
|
|
|
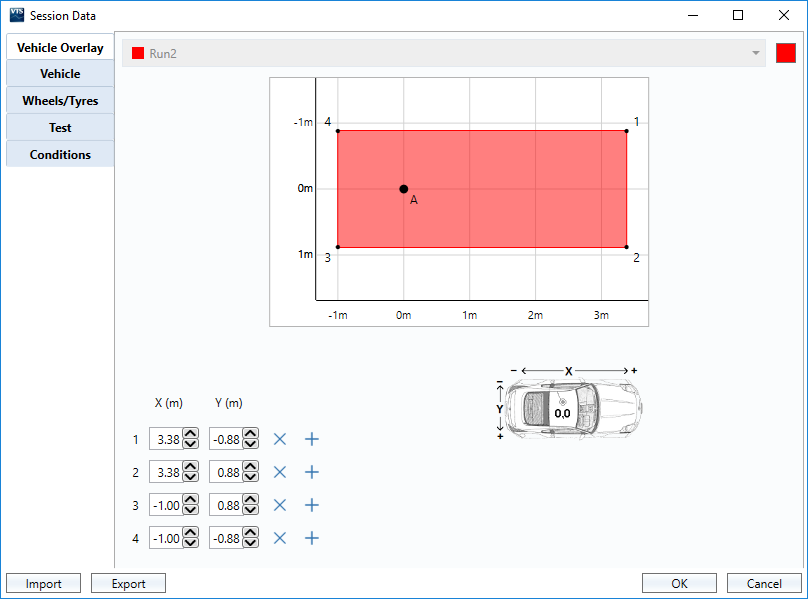
Once 'OK' is pressed, the software will create an object representing the vehicle and will overlay this on the cursor within the map area.
IMPORTANT - If no vehicle measurement points are entered, the antenna position is used for range calculations.
Other Information
-
Vehicle
- Vehicle Model
- Vehicle Number
- Driver Name
- Engine Model
- Kerb Mass
- Power
-
Wheels/Tyres
- Wheel Dimensions
- Tyre Make
- Tyre Dimensions
- Tyre Model
- Tyre Pressures
-
Test
- Test Date/Time
- Test Track
- Test Facility
- Comments
- Conditions
- Weather
- Temperature
- Track Temperature
- Humidity
- Wind Speed
When in 'Offline' mode, the Session Data information will be saved into the .vbo file meaning that this information will be recalled every time the file is loaded into VBOX Test Suite.
When in 'Online' mode, a newly-created session will be populated with session data from the previous session.
Note: The 'Other Information' parameters are purely optional and has no effect on the test or test result.
To save time, it is possible for the user to import and export the session information for use in other sessions (the entire range of data is exported not just the visible screen).
Once the session information has been completed, it is possible to export the data to a .vbses file. This file will contain all the session information that can then be imported into the open session information field.
Result Columns
Along the top of the Test results area are some default columns. These columns are:-
- Run – Indicates which run number the results relate to, with run one being the first run completed. There is also a selection box that, when ticked, includes that run in the graph and into the Average/Max/Min/Standard Deviation calculations. Once selected, a coloured square will appear to indicate which colour this run is displayed as on the graph.
Note: If you are loading a file offline, all valid runs are ticked automatically. - Time – The total time the run has taken.
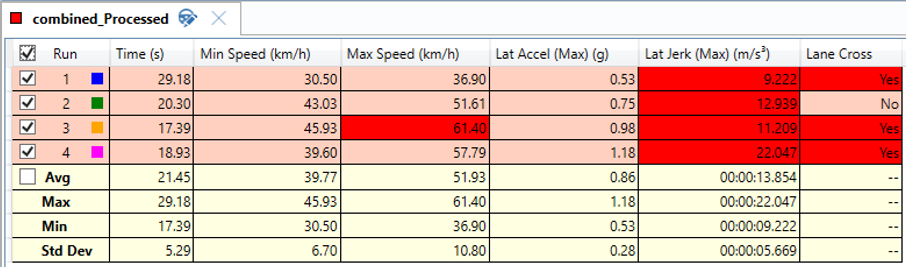
- Min Speed – The minimum speed during the run. If the Vsmin parameter is exceeded, this column will be highlighted deep red and the whole run will be highlighted light red.
- Max Speed – The max speed during the run. If the Vsmax parameter is exceeded, this column will be highlighted deep red and the whole run will be highlighted light red.
- Lat Accel (Max) – The maximum absolute value of lateral acceleration between the start of test and end of test. If the aysmax parameter is exceeded, this column will be highlighted deep red and the whole run will be highlighted light red.
Note: This channel is subject to a 4th order Butterworth filter with a 0.5 Hz cutoff. - Lat Jerk (Max) – The maximum absolute value of Lateral Jerk, which is the rate of change of lateral acceleration, smoothed over 0.5 s. This parameter has a pass condition of ±5 m/s³, if the value is exceeded, the column will be highlighted deep red and the whole run will be highlighted light red.
- Lane Cross – A YES/NO indication of whether the vehicle crossed the lane, if the Lane is crossed, this column will be highlighted deep red and the whole run will be highlighted light red.
UNR79 Specific L1 and L2 Measurements
|
Within the Add column drop down menu, a list of UNR79 specific measurements are available to choose from, e.g. RangeP1_L1.
|
 |
Editing a Column
As default, a column is added as an ‘At End’ condition. It is possible to change this by selecting the column title you wish to edit (once selected, the column will be highlighted in yellow) and changing the condition in the ‘data column’ area in the ‘Test Setup’ tab of the ribbon bar.
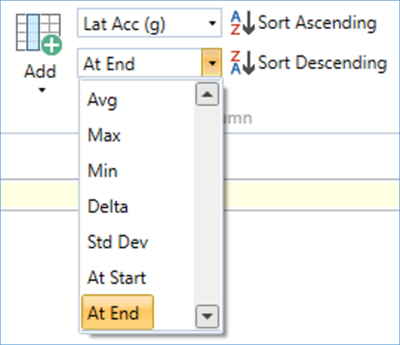
It is possible to choose the following conditions for the main results:-
- Avg – The mean average of the parameter during the run.
- Max – The maximum value of the parameter during the run.
- Min – The minimum value of the parameter during the run.
- Delta – The difference between the start and end value of the parameter.
- Std Dev – The standard deviation of the parameter during the run.
- At Start – The value of the parameter at the start of the run.
- At End – The value of the parameter at the end of the run.
- Gate – The value of the parameter at the crossing of the specified gate line (e.g. Start of Test).
It is also possible to change the displayed parameter, by using the other drop down menu on the ribbon tab and selecting the desired parameter.
Dashboard
Along with the usual dashboard functionality, the ‘UNR79 Max Lat. Acc.’ test has some extra options that can be displayed to the user.
By selecting the 'Add Gauge' button from the dashboard tab, a drop down menu will appear whereby the user can select 'Test' and then the desired parameter to be displayed. On selection, a gauge will be automatically added to the dashboard. Any gauges displaying a result of a test, such as an average or maximum value, will have a 'Result' icon  to the left of the gauge name to indicate that it is either a result of the previous run if viewing live data, or the currently selected run if viewing a saved file.
All Result Column parameters are also available as a gauge.
Showing Test Results on the Dashboard
It is possible to display the time and distance test results from the last run completed as a gauge on the dashboard.

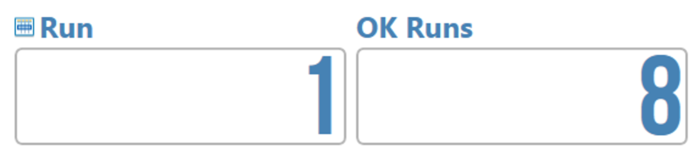
It is also possible to show the current run number on the dashboard to give an easy, clear indication of the amount of runs completed. An 'OK Runs' gauge can be added to indicate how many runs have met any specified pass conditions.
Distance/Time Since Run
The user can also add gauges to the dashboard that show a live value of either time or distance since the completion of the last run.
.png?revision=6)