05 - Circuit Tools - iOS Data Graph
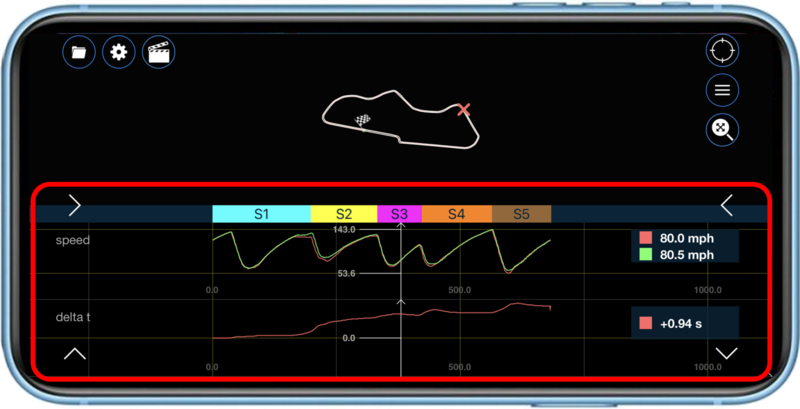
The Data Graph area displays selected Channels of particular laps (maximum of 2) plotted against time. It appears at the bottom half of the screen by default.
The trace from the fastest lap will automatically be selected and displayed when you load a file. You can choose a second lap to compare against in the Laps area (you can select a maximum of 2 laps for comparison). If you have loaded multiple files, the fastest lap from each file (maximum of 2) will automatically be selected and displayed for comparison.
The fastest lap, or if only one lap is selected, will have a green trace, and the second lap will have a red trace.
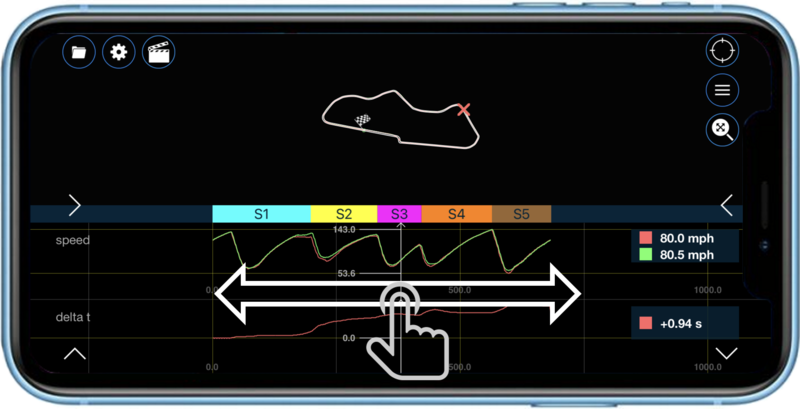
To move through a file, tap and drag the graph to the left or right. The legend on the right-hand side of the screen will update the channel values accordingly. Moving the cursor in the Data Graph area will also move the cursor in the Track area. If it is displaying a Video, the video will skip to the selected location. A coloured bar at the
top of the graph shows where each split is in relation to the graph data.
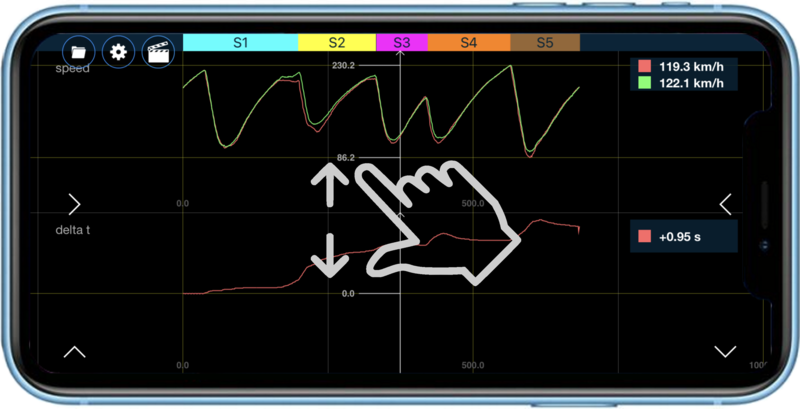
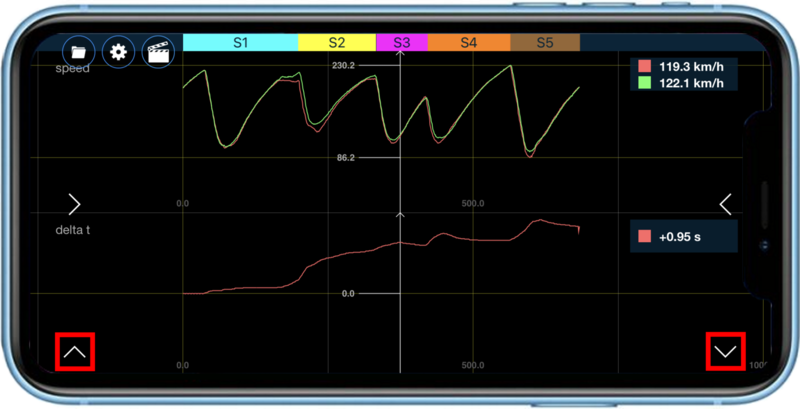
Tapping the the Up arrow ![]() at the bottom left of the screen will maximise the graph. Pressing the Down arrow
at the bottom left of the screen will maximise the graph. Pressing the Down arrow ![]() at the bottom right of the screen will return to the default track/video/graph view. You can also change the size of the Graph area by touching and dragging the coloured split bar.
at the bottom right of the screen will return to the default track/video/graph view. You can also change the size of the Graph area by touching and dragging the coloured split bar.
To zoom in on an area of interest, pinch out on the data graph. Pinch in to zoom back out.