R51 Pass-By Noise
Introduction
The ‘R51 Pass-By Noise’ test is a plugin for the VBOX Test Suite software.
The test itself allows the user to measure the Maximum Sound Pressure level of of motor vehicles having at least four wheels. The WOT tests must be conducted first, followed by the constant speed tests and then the ASEP test for the software automation of the plugin to work.
Pass-By Noise hardware and software setup information is available here.
Ribbon Bar
The R51 Pass-By Noise test has a tailored 'Test Setup' ribbon bar, from which the test and test area can be configured.

Note: Ribbon bar icons may move/ resize dependent on the Software window size.
Test

Configure
The 'Configure' button displays a pop up window whereby the parameters of the test can be defined.
Report
The 'Report' button creates a report from the current test results.This button is only available when a run or run has been selected from the test results window.
Save Settings
The 'Save Settings' button will save this individual test setup and will appear in the ‘Saved Settings’ area of the ‘Add Test’ window.
This test will also be added to the list of R51 Pass-By Noise tests under the 'Pass-By Noise' icon on the 'Home' tab for easy switching of the current test.
Gate

Add Start Line (space)
The 'Add Start Line' button allows the user to use VBOX Test Suite as an alternative to using the light barrier kit to set a start line. More information can be found below. This can also be achieved by using the keyboard space bar.
Edit Data
The 'Edit Data' button allows the user to enter session specific data such as driver name, track facility and weather data.
Test Configuration
Selecting the 'Configure' button will display a pop up window where the user can define the parameters of the test. These include the start and end conditions, as well as the pass conditions.
Use the up and down buttons  to the right of the parameters to Expand and Collapse the parameter headings.
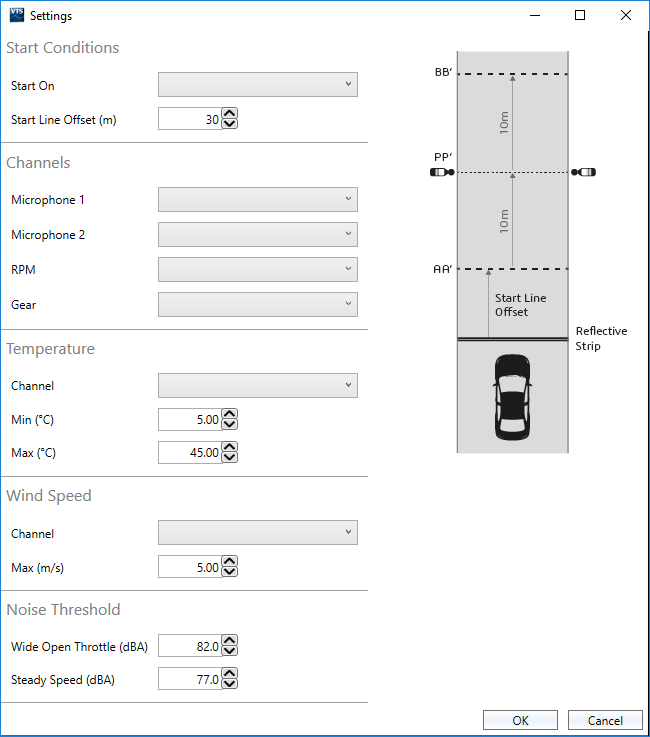
Channels
Allows the user to specify the channels to be used for the Microphones, RPM and Gear Position. Microphone 1 and RPM channels are mandatory before the test can be run.
Note: If 'Electric Vehicle' is selected within the 'Vehicle' of 'Session Data', the RPM channel does not need to be defined.
Creating Start Lines
Test Configuration with GPS Start Lines
Once the start lines have been created, Racelogic recommend the saving of test settings. This will allow the user to repeatedly recall these start lines without having to set them individually for each test.
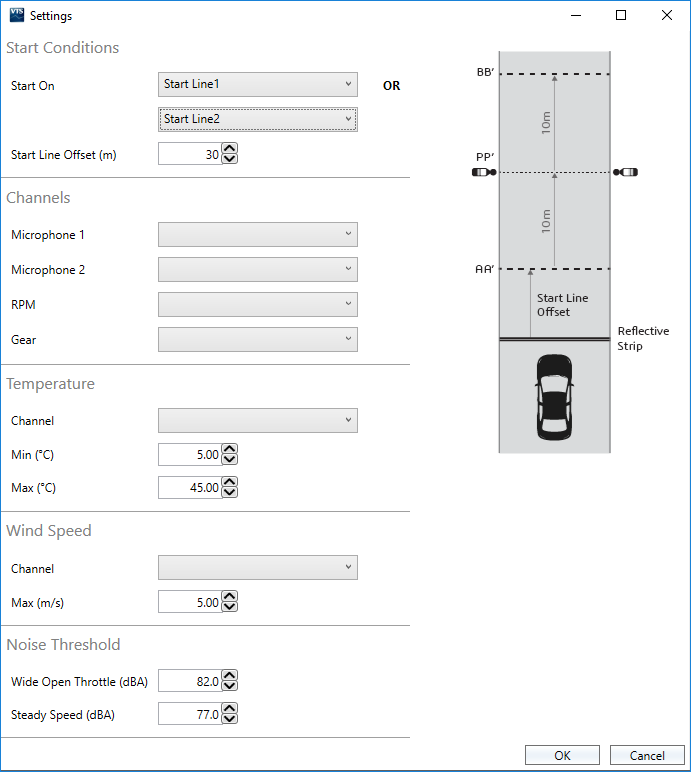
Since the test can be conducted in both directions, test settings can be modified such that the start on lines can be configured for 1 or 2 lines in the drop down menu.
In order to prevent situations where the start line offset is less than the vehicle front offset to the antenna, the minimum value of the start line offset is 5 m. The default value of the start line offset is 30 m.
Test Results Area
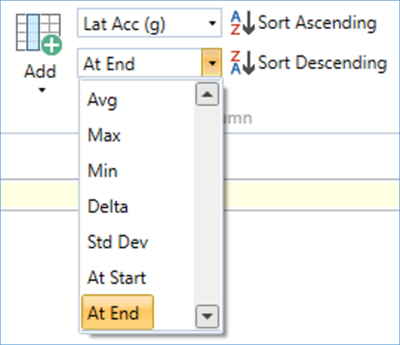
The test results area is the area that displays all of the results from the current test. Within this area it is possible to include/exclude results from the chart area, display the average/max/min values and also easily identify any runs which have not met the pass criteria.
Every time a new test is started (via the 'START' button on the dashboard), or a new file is loaded, a new tab will be added to the test results area, allowing the user to switch between separate tests or files and compare runs from each. A session can be removed from the results area by pressing the ‘x’ icon on the tab.
Session Data
By pressing the 'Edit Data' button .jpg?revision=4&size=bestfit&width=60&height=57) next to the name of the file/run or in the ‘Test Setup' ribbon bar, a new window will be displayed whereby the user can add various different pieces of vehicle and test information, such as:-
next to the name of the file/run or in the ‘Test Setup' ribbon bar, a new window will be displayed whereby the user can add various different pieces of vehicle and test information, such as:-
- Vehicle
- Vehicle Model
- Vehicle Number
- Driver Name
- Engine details
- Exhaust Model
- Mass in Running Order
- RPM details
- Electric Vehicle selection
- Measurements
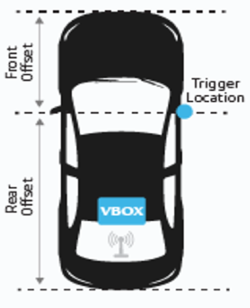
- Enter the front and rear vehicle offsets from the laser light trigger, or GNSS antenna if using GPS start/finish lines (required). The start of the test is deemed to be when the front of the vehicle passes the start line and the end is when the rear of the vehicle passes the finish line.
.png?revision=1)
- Set the vehicle engine location, which in turn relates to where vehicle measurements are made from, front, middle or rear. If not selected, measurements will be made from the front of the vehicle by default.
- Enter the front and rear vehicle offsets from the laser light trigger, or GNSS antenna if using GPS start/finish lines (required). The start of the test is deemed to be when the front of the vehicle passes the start line and the end is when the rear of the vehicle passes the finish line.
- Wheels/Tyres
- Wheel Dimensions
- Tyre Make
- Tyre Dimensions
- Tyre Model
- Tyre Pressures
- Test
- Test Date
- Test Track
- Test Facility
- Comments
- Conditions
- Weather
- Temperature
- Track Temperature
- Humidity
- Wind Speed
When in 'Offline' mode, this information will be saved into the .vbo file meaning that this information will be recalled every time the file is loaded into VBOX Test Suite.
When in 'Online' mode, a newly-created session will be populated with session data from the previous session.
This information will be included in the test report to allow the user to understand which result applies to which tyre.
Note: The vehicle offsets measurements are mandatory, however the other data is purely optional and has no effect on the test or test result.
To save time, it is possible for the user to import and export the session information for use in other sessions.
Once the session information has been completed, it is possible to export the data to a .vbses file. This file will contain all the session information that can then be imported into the open session information field.
Before starting a test, please ensure that Vehicle Offset Measurements are entered or imported from a previously saved .vbses file.
Result Columns
The software will create different tabs at the top of Test Results area to differentiate between wide-open throttle, steady speed and ASEP runs.
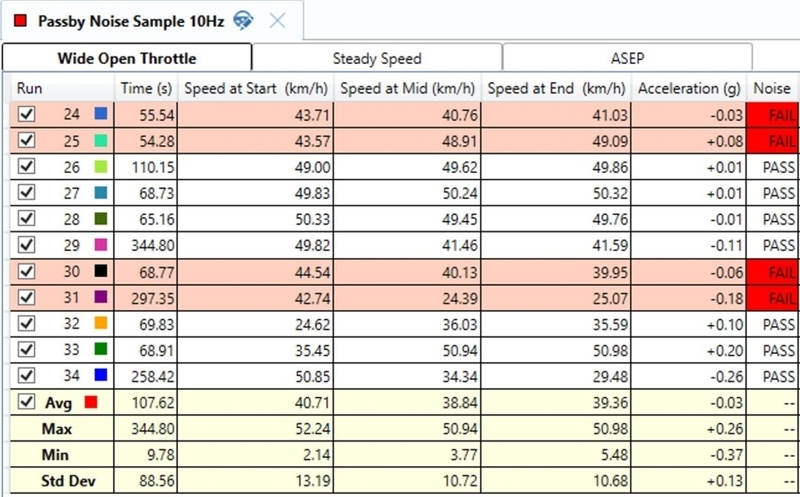
Along the top of the Test results area are some default columns. These columns are:-
- Run – Indicates which run number the results relate to, with run one being the first run completed. There is also a selection box that, when ticked, includes that run in the graph and into the Average/Max/Min/Standard Deviation calculations. Once selected, a coloured square will appear to indicate which colour this run is displayed as on the graph.
Note: If you are loading a file offline, all valid runs are ticked automatically. - Time – The total time the run has taken.
- Speed at Start – Speed value at the start line AA’.
- Speed at Mid – Speed value at the microphone line PP’.
- Speed at End – Speed value at the finish line BB’.
- Acceleration – Average acceleration value between lines AA’ and BB’.
- Mic1 Max – Maximum Sound Level value of Mic1.
- Mic2 Max – Maximum Sound Level value of Mic2.
- Noise – Pass or Fail Status when Mic1/2 Max is compared to the Noise Threshold value.
- RPM at Start – RPM value at the start line AA’.
- RPM at Mid – RPM value at the microphone line PP’.
- RPM at End – RPM value at the finish line BB’.
Dashboard
Along with the usual dashboard functionality, the ‘R51 Pass-By Noise ’ test has some extra options that can be displayed to the user.
By selecting the 'Add Gauge' button from the dashboard tab, a drop down menu will appear whereby the user can select 'Test' and then the desired parameter to be displayed. On selection, a gauge will be automatically added to the dashboard. Any gauges displaying a result of a test, such as an average or maximum value, will have a 'Result' icon  to the left of the gauge name to indicate that it is either a result of the previous run if viewing live data, or the currently selected run if viewing a saved file.
All Result Column parameters are also available as a gauge.
Creating a Report
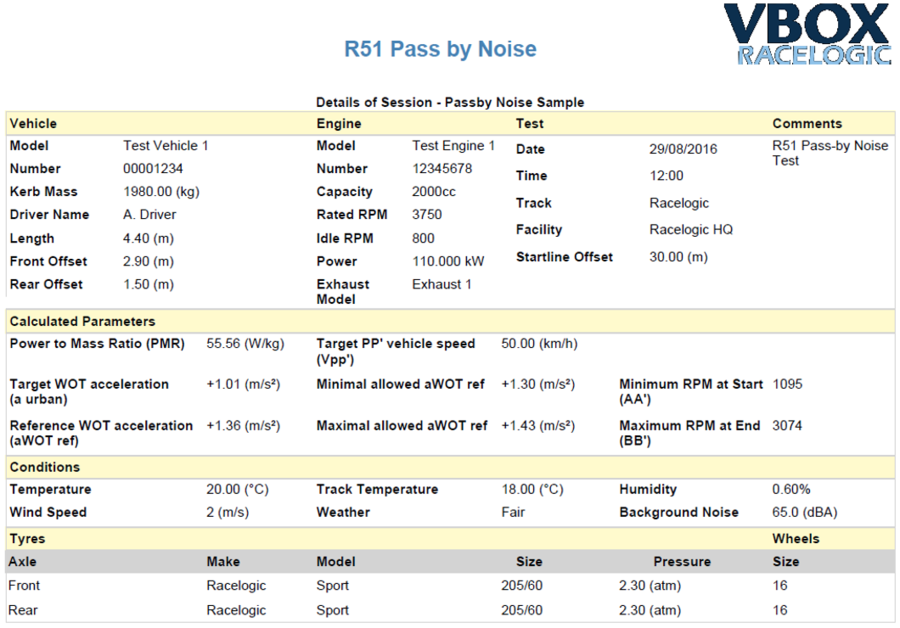
VBOX Test Suite allows the user to turn the results table into a custom report whereby the user can easily compare and display the results from their R51 Pass-by Noise test.
This report will include all of the previously entered session data, along with a table of results from each test as well as the calculated accelerations required by the test.
The user can then choose to print or save this report. A sample of this report can be seen below:-
.jpg?revision=1)





.png?revision=6)