06 - Circuit Tools Data Window
The Data window displays the values of the channels that have been logged at the position of the graph cursor. Speed and Delta-T are displayed by default. You can toggle each parameter on or off using the tick box in the Show column.
You can display up to 12 channels at the same time.
Note: Selected default GPS channels are retained after the software is closed and reopened. However, any additional selected CAN channels are not.
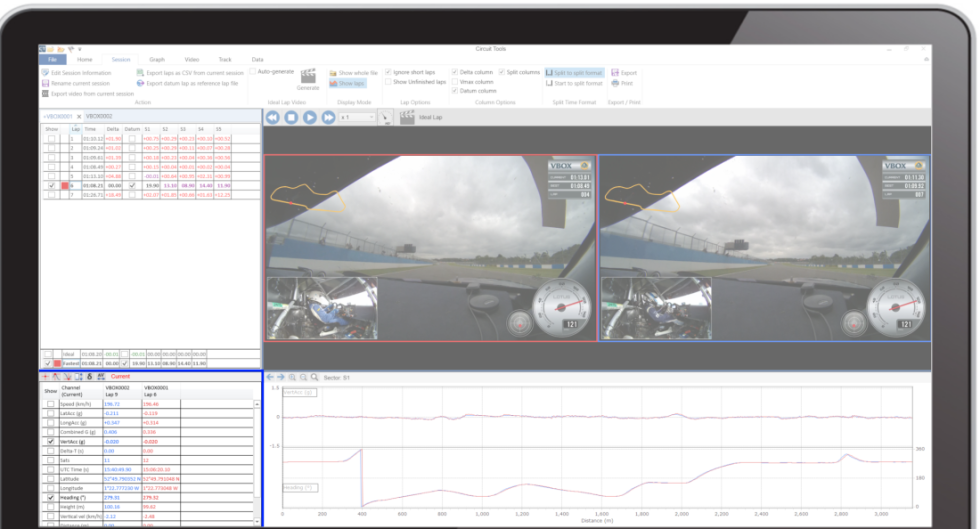
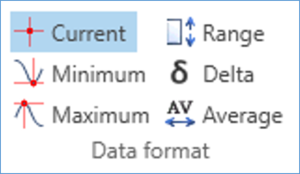
By default, the Current values of the channels are displayed. However, you can change these to Minimum, Maximum, Range, Delta or Average, by using the Quick buttons in the Data window or the Data menu tab.

As an example, if you have chosen the Minimum  function, the values now show the minimum values displayed in the current graph window.

Minimum function enabled
Channels that are not selected are shown as semi-transparent. You can change the transparency in the Opacity option under the Home tab. You can also change the size and type of Font used to display the channel values in this same area.

Available Channels
| Speed (km/h) | GPS Speed over ground |
| LatAcc (g) | Lateral acceleration (cornering g-force) |
| LongAcc (g) | Longitudinal acceleration (accel/braking g-force) |
| Delta-T (s) | Lap time difference between two laps |
| Sats | Number of satellites being tracked |
| UTC time (s) | Co-ordinated Universal Time |
| Latitude | Latitude position in degrees and minutes |
| Longitude | Longitude position in degrees and minutes |
| Heading (°) | Vehicle heading in degrees |
| Height (m) | Height |
| Vertical vel (km/h) | Vertical velocity |
| Distance (m) | Rolling distance travelled since start of lap |
| Elapsed time (s) | Elapsed time since start of lap |
Data Window Options
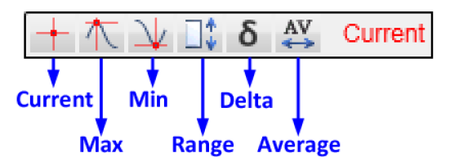
| Current | Current value at the cursor |
| Minimum | Lowest value on the displayed graph |
| Maximum | Highest value on the displayed graph |
| Range | Difference between the maximum and minimum on the displayed graph |
| Delta | Difference between the first point and last point on the displayed graph |
| Average | Average of all points on the graph (at current zoom level) |
Data Menu

Data Format
By default, the Current values of the channels are displayed in the Data window. However, you can change these to Minimum, Maximum, Range, Delta or Average by using the Data format options. You can find more information on these options above.
Hide Unwanted Channels
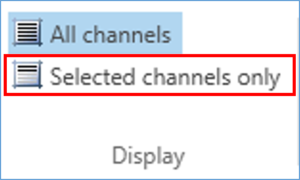
You can choose to show only the displayed channels and hide the non-selected items by using the Selected channels only button.
Export / Print
You can save the data view of the current position as a .csv file by selecting Export or print it by using the Print button.

External Inputs
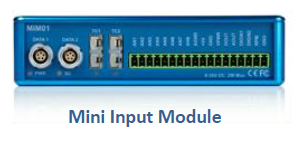
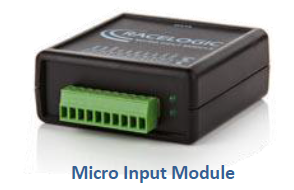
Most VBOXes are capable of logging additional channels. There are a number of different options available, the Mini-Input Module (8 analogue, 2 digital, 1 rpm), the Micro-input Module (4 analogue 1 rpm), or you can log vehicle parameters directly from the CAN bus (depending on Make, Model and Year).
If logged, these additional channels will then appear in the Data window automatically, and can be displayed on the graph in the same way as all the other channels.

