The Time and Motion plugin for VBOX Test Suite gives you the ability to generate reports to view how queuing time would change as a result of simulated speed limits and if there would be any occurrences of the excavator waiting.
The plugin includes features such as algorithms for queuing time and inputs for simulated maximum speed limits and load/dump locations.
The Time and Motion plugin as a unique Test Setup ribbon, from which you can configure the test.


Configure
Click on the Configure button to open the Settings window, where you can define the parameters of the test.
Report
Click on the Report button to create a report from the current test results.
Maths Channel
Click on the Maths Channels button to open the Maths Channels window to configure unique maths channels. You can find more information about maths channels in the Test Setup section.
Save Settings
Click on the Save Settings button to save the current test setup and add it to the Saved Settings area in the Add Test window.
The test will also be added to the list under the ADAS Test button on the Home tab for easy access.
Export
Click the Export button to display a dropdown menu with the export options. You can export the selected results or line results to a .csv or a .txt file.

Add Gate
Click the Add Gate button to add a virtual gate to the chart and map at the point of the cursor.
Gates are green lines on the map. The line of the currently selected gate will become blue.
You can now use the gates to define start and/or end conditions.
IMPORTANT
Opening a plugin (either as a new tab or overwriting an existing one) will clear all set gates.
To amend the test configuration and apply start and end conditions, you will have to redefine the gates.
Gate Name
When adding gates, the name of the currently selected gate will be displayed in the name box.
The gates will be named according to the type of gate (if applicable) and the order they were added.
Click on the arrow to see a dropdown list of all added gates.
NOTE
Each gate must have a unique name.
Width
When you have added a gate, you can specify the gate width.
The default gate width is 20 m.
Enter the new width in the Width (m) box.
NOTE
After changing the gate width, that width is automatically used as the default for subsequent gates.
Rename
Click on the Rename button to edit the name of the currently selected gate.
Delete
Click on the Delete button to delete the currently selected gate.
Delete All
Click on the Delete All button to delete all set gates for the session.
Export
Click on the Export button to export the created gate(s) as an .spl file.
This file can be reused at a later date and with other VBOX products.
Import
Click on the Import button to import a previously saved or provided .spl file. When the file is imported, the gates will be added in the order they were saved to the file.

Add
The Add button adds a column to the Test Results area.
Click this button to open a dropdown menu where you can select a channel to display in the test results window.
Channel
When you select a column header in the Test Results area, the channel name will be displayed in the Channel box (the top box in the Data Column section).
Some columns will have required channels that cannot be changed.
If the channel can be changed, the Channel box will become a drop-down list with the available channels.


Result Condition
When you select a column header in the Test Results area, and it is an optional channel, the Condition dropdown menu becomes available.
The conditions in the list will depend on the test and the selected channel.
Examples are:
- Avg
- Max
- Min
- Delta
- At Start
- At End
Sort Ascending
The Sort Ascending button will sort the values in the currently selected column in the Test Results area in alphabetical order from A to Z.
Sort Descending
The Sort Descending button will sort the values in the currently selected column in the Test Results area in alphabetical order from Z to A.

Select All
Click on the Select All button to select every run in the Test Results area with one click.
Deselect All
Click on the Deselect All button to deselect every run in the Test Results area with one click.

Edit Data
Click on the Edit Data button to open the Session Data window and add various vehicle and test information.
When in Offline mode, the Session Data will be saved into the VBOX file. This information will be recalled every time the file is loaded into VBOX Test Suite.
When in Online mode, a newly created session will be populated with session data from the previous session.
To save time, you can import and export the session data for other sessions. When you have completed the Session Data, you can export the data to a .vbses file by clicking on the Export button in the Session Data window. The exported file will contain all the session data and can be imported into another session via the Import button in the Session Data window.

Time Zone
Select the relevant time zone for the test location.

Help
Click on Help to automatically open an Internet browser and load the relevant section of the User Guide on the Racelogic Support Centre.
NOTE
This page will only be displayed if there is a valid internet connection. If there is no valid internet connection, a cached version of the relevant section (from the last software update) will be presented in PDF form.

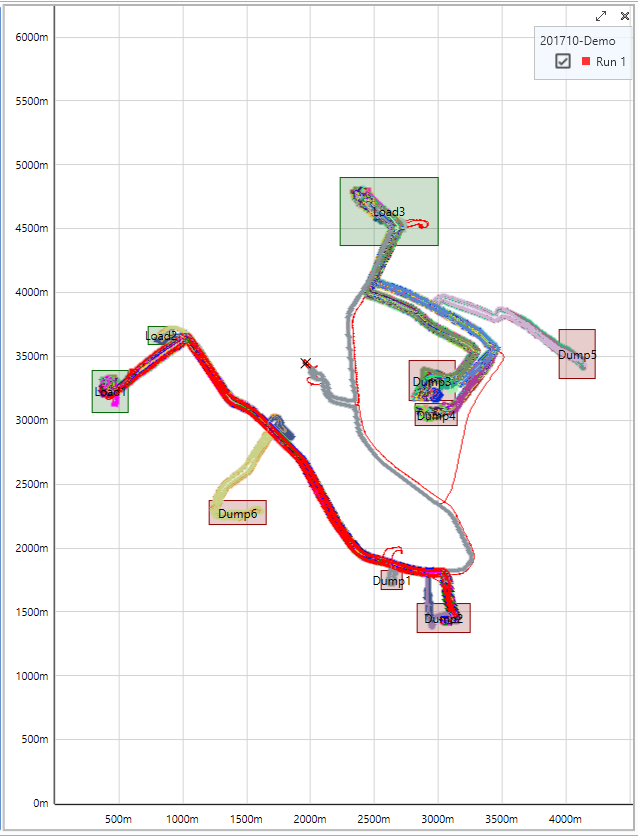
On the Map, you can define load/dump locations by selecting Add Region. This allows the software to detect whether a vehicle is loaded or unloaded based on regular movements.
Ensure that the region is placed correctly so as not to miss any areas in which load status may have changed. For instance, make sure all dump locations are captured as dump regions and all load points are captured as load regions. To reduce the chance of error, avoid load/dump regions at traffic hold points, such as intersections.
You can also rename load/dump locations as the relevant circuit will be represented in Results and the Report as “Load”-“Dump”-“Load”.
If you are creating a new test, the Settings window will open when you add the new test. This is where you can define the test parameters.
If you have already added an Accel test and you have it open, you can click on the Configure button to open the Settings window to define or amend the test parameters.

Load Area Approach Speed (km/h)
Specify the approach speed to the load area in km/h.
Use the arrow buttons next to the value box to increase/decrease the speed, or type the required speed directly into the value box.

Load Area Approach Speed (km/h)
Specify the approach speed to the load area in km/h.
Use the arrow buttons next to the value box to increase/decrease the speed, or type the required speed directly into the value box.

Speed Limits (km/h)
Specify the required speed limits.
Use the arrow buttons next to the value box to increase/decrease the speed, or type the required speed directly into the value box.
Click on the + button to add another speed limit.
Click on the X button next to set a speed limit to delete it.
Minimum number of runs for inclusion in report
Specify the minimum number of runs for the test to be included in the report.
Use the arrow buttons next to the value box to increase/decrease the number of runs directly into the value box.

Minimum number of runs for inclusion in report
Specify the minimum number of runs for the test to be included in the report.
Use the arrow buttons next to the value box to increase/decrease the number of runs directly into the value box.

Standard Deviation
Specify the standard deviation for the report.
Use the arrow buttons next to the value box to increase/decrease the deviation or type the required value directly into the value box.
Minimum Load Time (s)
Specify the minimum load time in seconds.
Use the arrow buttons next to the value box to increase/decrease the load time, or type the required load time directly into the value box.

Minimum Load Time (s)
Specify the minimum load time in seconds.
Use the arrow buttons next to the value box to increase/decrease the load time, or type the required load time directly into the value box.

Minimum Dump Time (s)
Specify the minimum dump time in seconds.
Use the arrow buttons next to the value box to increase/decrease the minimum dump time, or type the required minimum dump time directly into the value box.
Maximum Load Speed (km/h)
Specify the maximum load speed in km/h.
Use the arrow buttons next to the value box to increase/decrease the speed, or type the required speed directly into the value box.
Maximum Dump Speed (km/h)
Specify the maximum dump speed in km/h.
Use the arrow buttons next to the value box to increase/decrease the dump speed, or type the required speed directly into the value box.
The Test Results area is the area that displays all of the results from the current test. In this area, you can include/exclude results from the Chart area, display the average/max/min values and also easily identify any runs that have not met the pass criteria.
Every time you start a new test (via the START button on the dashboard), or load a new file, a new tab will be added to the Test Results area. This gives you the ability to switch between separate tests or files and compare runs from each. You can remove a session from the Test Results area by clicking on the X icon on the session tab.
NOTE
Whenever you make any changes to the test configuration, maths channels, vehicle dimensions, test units or session data, Test Suite will perform a file scan to apply the changes to the loaded files and update the Test Results, Map and Chart areas.
If you want to cancel the results scan, click the red X in the top right-hand corner of the workspace. This will keep the updated settings, but will not update the Test Results, Map and Chart areas accordingly.
You can rename a session tab by double-clicking the tab header.
Changing the name on the session tab in the software will automatically change the name of the locally saved VBOX file (.vbo or .vbb).
By pressing the Edit Data button next to the name of the session in the Test Results area or on the Test Setup tab on the ribbon, you can add vehicle and test information to the session.
- When in Offline mode, this information will be saved into the VBOX file, meaning that this information will be recalled every time the file is loaded into VBOX Test Suite.
- When in Online mode, a newly created session will be populated with session data from the previous session.
This information will be included in the test report to make it easier to see under what conditions the test was conducted.
To save time, you can import and export the session information for use in other sessions (the entire range of data is exported, not just the visible screen).
Once the session information has been completed, you can export the data to a .vbses file. This file will contain all the session information that can then be imported into the open session information field.

The Test Results area has the following default columns for Time and Motion tests:
| Run | Indicates which run number the results relate to, with run one being the first run completed. There is also a selection box that, when ticked, includes the run in the graph and into the Average/Max/Min/Standard Deviation calculations. Once selected, a coloured square will appear to indicate which colour this run is displayed as on the graph. If you are loading a file in Offline mode, all valid runs will automatically be ticked. |
|---|---|
| Cycle | The start and end location of the journey cycle. |
| Depart Dump | The time at which the vehicle left the Dump area. |
| Journey Time | The total time of the journey. |
| Queue Time | The total time spent queueing in this cycle. |
| Load Start | The start time of the load. |
| Queue Count | The total number of times the vehicle stopped while queueing. |
| Queue @ 50 | The projected queue time if the vehicle travelled at 50 during the cycle. |
| Queue @ 40 | The projected queue time if the vehicle travelled at 40 during the cycle. |
| Queue @ 30 | The projected queue time if the vehicle travelled at 30 during the cycle. |
| Queue @ 20 | The projected queue time if the vehicle travelled at 20 during the cycle. |
The software will automatically add columns based on the configured settings.